Could someone please give me some guidance on how to answer these, it's like looking at another language.
Thank you in advance
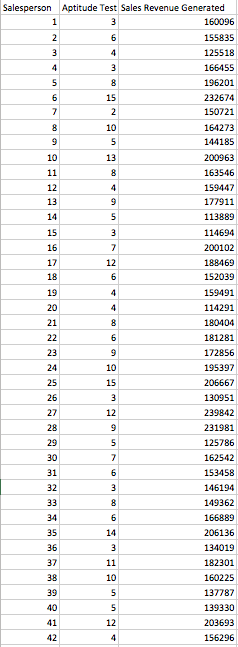
(a) Use the built regression tool in Excel and your personalized data set (see above) to estimate the simple regression of sales revenue in dollars (Y) generated by a salesperson in his/her first year of completed service on the salesperson’s aptitude test score (X). (2 marks)
When answering the following questions, assume all the assumptions of the neoclassical (stochastic regressor) simple regression (NSR) model with multivariate normally distributed random disturbances are satisfied.
(b) Clearly state your estimated conditional expectation function (sample regression line). Note that you do not need to estimate your equation manually, but rather you should simply write down your sample regression line using the estimated intercept and coefficient of X given in your summary regression output from Excel. (1 mark)
(c) With reference to your estimated equation, calculate (using a calculator) a 90% confidence interval for the coefficient (β2 ) of X in the model. In performing this calculation, use the relevant estimated standard error of the estimator of the coefficient of X given in your summary Excel regression output. Give an interpretation of the confidence interval you calculate. (2 marks)
(d) Again with reference to your estimated equation, perform a test of the null hypothesis that the coefficient (β2 ) of the aptitude test score of a salesperson equals zero against
the alternative that it is greater than zero, using the α = 0.05 (i.e. 5%) level of significance. In presenting your answer to this question you are required to use the 6- step hypothesis testing procedure given in the unit summary lecture notes. Again in answering this question, you should use the relevant estimated standard error of the estimator of the coefficient of X given in your summary Excel regression output. (3 marks)
(e) Give an interpretation of the realized coefficient of determination value (r2 ) given in your summary Excel regression output. (2 marks)
Homework Answers
(a)
| SUMMARY OUTPUT | ||||||||
| Regression Statistics | ||||||||
| Multiple R | 0.78168639 | |||||||
| R Square | 0.611033613 | |||||||
| Adjusted R Square | 0.601309453 | |||||||
| Standard Error | 20116.232 | |||||||
| Observations | 42 | |||||||
| ANOVA | ||||||||
| df | SS | MS | F | Significance F | ||||
| Regression | 1 | 25427653896 | 2.54E+10 | 62.83665 | 9.93216E-10 | |||
| Residual | 40 | 16186511599 | 4.05E+08 | |||||
| Total | 41 | 41614165494 | ||||||
| Coefficients | Standard Error | t Stat | P-value | Lower 95% | Upper 95% | Lower 90.0% | Upper 90.0% | |
| Intercept | 117263.1332 | 6973.825793 | 16.81475 | 9.77E-20 | 103168.5055 | 131357.7609 | 105520.2496 | 129006.0169 |
| X Variable 1 | 6884.587431 | 868.5031734 | 7.926957 | 9.93E-10 | 5129.277041 | 8639.897821 | 5422.157483 | 8347.01738 |

Add Answer to:
Could someone please give me some guidance on how to answer these, it's like looking at another language. Thank you...
Develop a scatter plot with HRS1 (how many hours per week one works) as the dependent variable and age as the independe...
Develop a scatter plot with HRS1 (how many hours per week one works) as the dependent variable and age as the independent variable. Include the estimated regression equation and the coefficient of determination on your scatter plot. Does there appear to be a relationship between these variables (HRS1 and age)? Briefly explain and justify your answer. Calculate the slope (b1) and intercept (b0) coefficients and use them to develop an estimated regression equation that can be used to predict HRS1...
Please help me do it. And please tell me the way you do it, thank you:)
 Please help me do it.
And please tell me the way you do it, thank you:)
3. Eight students were sampled from a school with their final exam scores, Y, and hours studied, X. Assume the linear regression model is appropriate. hours studied 8 9 5 6 7 10 8 8 exam scores 78 85 65 70 75 90 82 80 2x61, y 625, 483 y,2 49283 , 2xyi-4855 (xi-x)2 17.875 , Oz_y)2 454.875 , (xī_x)(yi-у) 89.375 (a) Write down...
Please help me do it.
And please tell me the way you do it, thank you:)
3. Eight students were sampled from a school with their final exam scores, Y, and hours studied, X. Assume the linear regression model is appropriate. hours studied 8 9 5 6 7 10 8 8 exam scores 78 85 65 70 75 90 82 80 2x61, y 625, 483 y,2 49283 , 2xyi-4855 (xi-x)2 17.875 , Oz_y)2 454.875 , (xī_x)(yi-у) 89.375 (a) Write down...
a. Develop a scatter plot with HRS1 (how many hours per week one works) as the...
a. Develop a scatter plot with HRS1 (how many hours per week one works) as the dependent variable and age as the independent variable. Include the estimated regression equation and the coefficient of determination on your scatter plot. [ 1.5 points] b. Does there appear to be a relationship between these variables (HRS1 and age)? Briefly explain and justify your answer.[ 1 point] c. Calculate the slope (b1) and intercept (b0) coefficients and use them to develop an estimated regression...
could you please if it's possible to attach the answer in cpp form. Thank you in...
 could you please if it's possible to attach the answer
in cpp form.
Thank you in advanced.
L7 8 9] 142 48 54) 2. Write a code for the subtraction of 2 matrices [2 x 3). Both matrices elements should be given by the user. Display the results on the screen. (example below) 1o)-64 $ 3) = 14 4 1 Imunotor Yactor elements should be given by
could you please if it's possible to attach the answer
in cpp form.
Thank you in advanced.
L7 8 9] 142 48 54) 2. Write a code for the subtraction of 2 matrices [2 x 3). Both matrices elements should be given by the user. Display the results on the screen. (example below) 1o)-64 $ 3) = 14 4 1 Imunotor Yactor elements should be given by
Appreciate if you can answer this ONE QUESTION COMPLETELY and give me a detailed working with...
 Appreciate if you can answer this ONE QUESTION
COMPLETELY and give me a detailed working with explanation
for me to understand. Once completed so long as my doubts are
cleared and the solutions are correct, I will definitely vote up.
Some of the question are similiar to take a look carefully before
you answer as it's very important for me.
Thank you.
Question 4 (a) Suppose that the length of time t (in days) between sales for an automobile salesperson...
Appreciate if you can answer this ONE QUESTION
COMPLETELY and give me a detailed working with explanation
for me to understand. Once completed so long as my doubts are
cleared and the solutions are correct, I will definitely vote up.
Some of the question are similiar to take a look carefully before
you answer as it's very important for me.
Thank you.
Question 4 (a) Suppose that the length of time t (in days) between sales for an automobile salesperson...
Please show instructions on how you got the answer. Thank you. Question 1: Question 2: Given...
 Please show instructions on how you got the answer. Thank
you.
Question 1:
Question 2:
Given are five observations for two variables, x and y. 1 2 3 4 (a) Develop a scatter diagram for these data. (b) What does the scatter diagram developed in part (a) indicate about the relationship between the two variables? There appears to be a negative linear relationship between x and y. There appears to be a positive linear relationship between x and y. There...
Please show instructions on how you got the answer. Thank
you.
Question 1:
Question 2:
Given are five observations for two variables, x and y. 1 2 3 4 (a) Develop a scatter diagram for these data. (b) What does the scatter diagram developed in part (a) indicate about the relationship between the two variables? There appears to be a negative linear relationship between x and y. There appears to be a positive linear relationship between x and y. There...
Please provide your answer with a detailed description on how you came to that answer please!...
 Please provide your answer with a detailed description on how you
came to that answer please!
ECN 702 Econometrics II HW2 Due: Jan 29 1. Suppose the true conditional mean function is but by mistake, a researcher ran least square regression without the x term as in Assume cov (X,, U,)s 0, E [Xn]-O and E [x?J-1. Is hisher estimate consistent for Anf not, show which OLS assumption fails and discuss potential solutions. 2. Assume the structural equation is where...
Please provide your answer with a detailed description on how you
came to that answer please!
ECN 702 Econometrics II HW2 Due: Jan 29 1. Suppose the true conditional mean function is but by mistake, a researcher ran least square regression without the x term as in Assume cov (X,, U,)s 0, E [Xn]-O and E [x?J-1. Is hisher estimate consistent for Anf not, show which OLS assumption fails and discuss potential solutions. 2. Assume the structural equation is where...
from part 5-12 plz dont do 1-4 BUNUS Assignment! A Sample Data AnalySIS III Licer Please...
 from part 5-12 plz dont do 1-4
BUNUS Assignment! A Sample Data AnalySIS III Licer Please answer all of the following questions. Make sure you show all your work, providing snapshots from Excel as well as listing all formulas and relevant explanation, as needed. We are interested in exploring the relationship between the income of professors (measured in thousands of dollars) and the number of years they have been employed by the university. We collect the following data from eight...
from part 5-12 plz dont do 1-4
BUNUS Assignment! A Sample Data AnalySIS III Licer Please answer all of the following questions. Make sure you show all your work, providing snapshots from Excel as well as listing all formulas and relevant explanation, as needed. We are interested in exploring the relationship between the income of professors (measured in thousands of dollars) and the number of years they have been employed by the university. We collect the following data from eight...
please provide detailed answer thank you! For the data shown below, calculate the Pearson linear correlation...
 please provide detailed answer thank you!
For the data shown below, calculate the Pearson linear correlation coefficient (r) and find the regression equation (y = bo + bx). er х 1 2 3 4 у 17.9 21.4 25.1 25.6 26.1 31.9 31.5 33.1 5 6 7 8 Round all your answers to 3 places after the decimal point, if necessary. T Regression equation: Make sure that you enter the y-intercept in the first box and the slope (the coefficient of...
please provide detailed answer thank you!
For the data shown below, calculate the Pearson linear correlation coefficient (r) and find the regression equation (y = bo + bx). er х 1 2 3 4 у 17.9 21.4 25.1 25.6 26.1 31.9 31.5 33.1 5 6 7 8 Round all your answers to 3 places after the decimal point, if necessary. T Regression equation: Make sure that you enter the y-intercept in the first box and the slope (the coefficient of...
CAN YOU PLEASE ANSWER ALL THE QUESTIONS FOR ME I WILL GIVE YOUR ANSWER A LIKE...
 CAN YOU PLEASE ANSWER ALL THE QUESTIONS FOR ME I WILL
GIVE YOUR ANSWER A LIKE
1. (8 points) Let r(0) = k tan o be a curve defined in polar coordinates, where k is a nonzero real constant. Find the correct formula for " dy dx 2. (10 points) Given below are the graphs of two functions y = f(x) and y = g(x). Use the graphs to find the indicated value. y = f(x) y = g(x) WN...
CAN YOU PLEASE ANSWER ALL THE QUESTIONS FOR ME I WILL
GIVE YOUR ANSWER A LIKE
1. (8 points) Let r(0) = k tan o be a curve defined in polar coordinates, where k is a nonzero real constant. Find the correct formula for " dy dx 2. (10 points) Given below are the graphs of two functions y = f(x) and y = g(x). Use the graphs to find the indicated value. y = f(x) y = g(x) WN...
 Please help me do it.
And please tell me the way you do it, thank you:)
3. Eight students were sampled from a school with their final exam scores, Y, and hours studied, X. Assume the linear regression model is appropriate. hours studied 8 9 5 6 7 10 8 8 exam scores 78 85 65 70 75 90 82 80 2x61, y 625, 483 y,2 49283 , 2xyi-4855 (xi-x)2 17.875 , Oz_y)2 454.875 , (xī_x)(yi-у) 89.375 (a) Write down...
Please help me do it.
And please tell me the way you do it, thank you:)
3. Eight students were sampled from a school with their final exam scores, Y, and hours studied, X. Assume the linear regression model is appropriate. hours studied 8 9 5 6 7 10 8 8 exam scores 78 85 65 70 75 90 82 80 2x61, y 625, 483 y,2 49283 , 2xyi-4855 (xi-x)2 17.875 , Oz_y)2 454.875 , (xī_x)(yi-у) 89.375 (a) Write down...
 could you please if it's possible to attach the answer
in cpp form.
Thank you in advanced.
L7 8 9] 142 48 54) 2. Write a code for the subtraction of 2 matrices [2 x 3). Both matrices elements should be given by the user. Display the results on the screen. (example below) 1o)-64 $ 3) = 14 4 1 Imunotor Yactor elements should be given by
could you please if it's possible to attach the answer
in cpp form.
Thank you in advanced.
L7 8 9] 142 48 54) 2. Write a code for the subtraction of 2 matrices [2 x 3). Both matrices elements should be given by the user. Display the results on the screen. (example below) 1o)-64 $ 3) = 14 4 1 Imunotor Yactor elements should be given by
 Appreciate if you can answer this ONE QUESTION
COMPLETELY and give me a detailed working with explanation
for me to understand. Once completed so long as my doubts are
cleared and the solutions are correct, I will definitely vote up.
Some of the question are similiar to take a look carefully before
you answer as it's very important for me.
Thank you.
Question 4 (a) Suppose that the length of time t (in days) between sales for an automobile salesperson...
Appreciate if you can answer this ONE QUESTION
COMPLETELY and give me a detailed working with explanation
for me to understand. Once completed so long as my doubts are
cleared and the solutions are correct, I will definitely vote up.
Some of the question are similiar to take a look carefully before
you answer as it's very important for me.
Thank you.
Question 4 (a) Suppose that the length of time t (in days) between sales for an automobile salesperson...
 Please show instructions on how you got the answer. Thank
you.
Question 1:
Question 2:
Given are five observations for two variables, x and y. 1 2 3 4 (a) Develop a scatter diagram for these data. (b) What does the scatter diagram developed in part (a) indicate about the relationship between the two variables? There appears to be a negative linear relationship between x and y. There appears to be a positive linear relationship between x and y. There...
Please show instructions on how you got the answer. Thank
you.
Question 1:
Question 2:
Given are five observations for two variables, x and y. 1 2 3 4 (a) Develop a scatter diagram for these data. (b) What does the scatter diagram developed in part (a) indicate about the relationship between the two variables? There appears to be a negative linear relationship between x and y. There appears to be a positive linear relationship between x and y. There...
 Please provide your answer with a detailed description on how you
came to that answer please!
ECN 702 Econometrics II HW2 Due: Jan 29 1. Suppose the true conditional mean function is but by mistake, a researcher ran least square regression without the x term as in Assume cov (X,, U,)s 0, E [Xn]-O and E [x?J-1. Is hisher estimate consistent for Anf not, show which OLS assumption fails and discuss potential solutions. 2. Assume the structural equation is where...
Please provide your answer with a detailed description on how you
came to that answer please!
ECN 702 Econometrics II HW2 Due: Jan 29 1. Suppose the true conditional mean function is but by mistake, a researcher ran least square regression without the x term as in Assume cov (X,, U,)s 0, E [Xn]-O and E [x?J-1. Is hisher estimate consistent for Anf not, show which OLS assumption fails and discuss potential solutions. 2. Assume the structural equation is where...
 from part 5-12 plz dont do 1-4
BUNUS Assignment! A Sample Data AnalySIS III Licer Please answer all of the following questions. Make sure you show all your work, providing snapshots from Excel as well as listing all formulas and relevant explanation, as needed. We are interested in exploring the relationship between the income of professors (measured in thousands of dollars) and the number of years they have been employed by the university. We collect the following data from eight...
from part 5-12 plz dont do 1-4
BUNUS Assignment! A Sample Data AnalySIS III Licer Please answer all of the following questions. Make sure you show all your work, providing snapshots from Excel as well as listing all formulas and relevant explanation, as needed. We are interested in exploring the relationship between the income of professors (measured in thousands of dollars) and the number of years they have been employed by the university. We collect the following data from eight...
 please provide detailed answer thank you!
For the data shown below, calculate the Pearson linear correlation coefficient (r) and find the regression equation (y = bo + bx). er х 1 2 3 4 у 17.9 21.4 25.1 25.6 26.1 31.9 31.5 33.1 5 6 7 8 Round all your answers to 3 places after the decimal point, if necessary. T Regression equation: Make sure that you enter the y-intercept in the first box and the slope (the coefficient of...
please provide detailed answer thank you!
For the data shown below, calculate the Pearson linear correlation coefficient (r) and find the regression equation (y = bo + bx). er х 1 2 3 4 у 17.9 21.4 25.1 25.6 26.1 31.9 31.5 33.1 5 6 7 8 Round all your answers to 3 places after the decimal point, if necessary. T Regression equation: Make sure that you enter the y-intercept in the first box and the slope (the coefficient of...
 CAN YOU PLEASE ANSWER ALL THE QUESTIONS FOR ME I WILL
GIVE YOUR ANSWER A LIKE
1. (8 points) Let r(0) = k tan o be a curve defined in polar coordinates, where k is a nonzero real constant. Find the correct formula for " dy dx 2. (10 points) Given below are the graphs of two functions y = f(x) and y = g(x). Use the graphs to find the indicated value. y = f(x) y = g(x) WN...
CAN YOU PLEASE ANSWER ALL THE QUESTIONS FOR ME I WILL
GIVE YOUR ANSWER A LIKE
1. (8 points) Let r(0) = k tan o be a curve defined in polar coordinates, where k is a nonzero real constant. Find the correct formula for " dy dx 2. (10 points) Given below are the graphs of two functions y = f(x) and y = g(x). Use the graphs to find the indicated value. y = f(x) y = g(x) WN...
Most questions answered within 3 hours.
-
Calculate the number density of argon gas at a temperature of
24C and a pressure of...
asked 2 hours ago -
Alternative
Classification
How to Estimate
Probabilities from Data? ( For continuous Attributes)
And How to generate...
asked 2 hours ago -
An explosion breaks a 20.0-kg object into three parts. The
object is initially moving at a...
asked 3 hours ago -
Calculate the approximate number of residues of Rubisco, which
is involved in carbon fixation in plants,...
asked 4 hours ago -
Other decisions about scientific claims can have a much broader
impact.ENERGYarrow-10x10.png, environment, health, security - all...
asked 5 hours ago -
I need to write a research paper and work cited about this
topic: The United States...
asked 5 hours ago -
Hello! I was wondering if I could have some help?
If the vapor pressure of carvone...
asked 6 hours ago -
An economist wants to estimate the mean per capita income (in
thousands of dollars) for a...
asked 6 hours ago -
What would be the input/output characteristic of a circuit
obtained by putting two of your 2's-complementers...
asked 6 hours ago -
In Drosophila, the transition from the syncytial blastoderm
stage to the cellular blastoderm stage is a...
asked 6 hours ago -
Project management question:
Name 3 different types of resources (hint: humans are one
type)
asked 7 hours ago -
Consider the following reaction: C 2H 2( g) + 2H 2( g) C 2H 6(
g)...
asked 7 hours ago