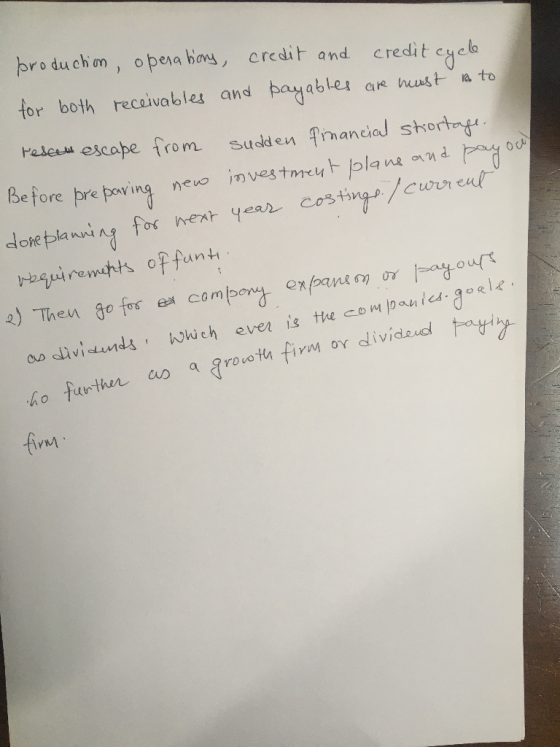
 a) Discuss the process of
preparing a financial plan.
a) Discuss the process of
preparing a financial plan.
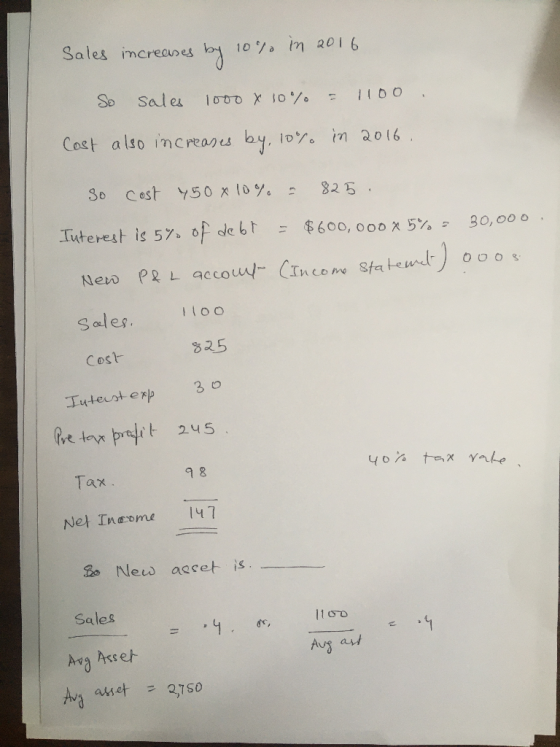
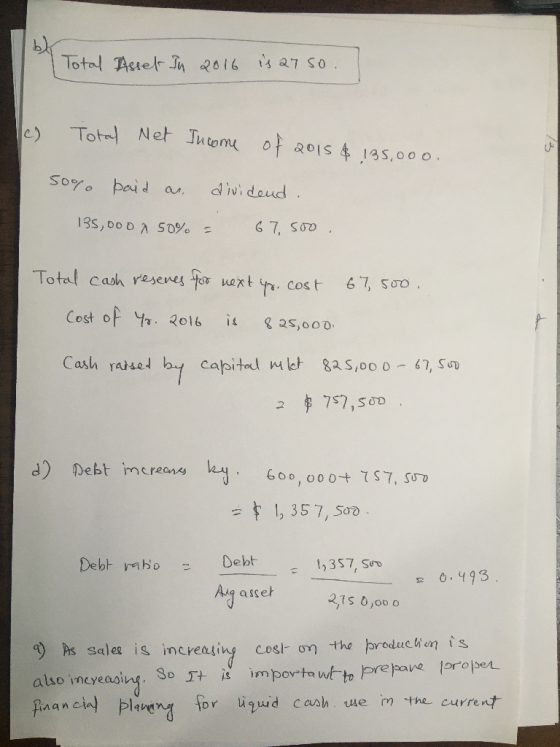
b) What is the implied level of assets at the end of 2016?
c) If the company pays out 50% of net income as dividends, how much
cash will
Drake need to raise in the capital markets in 2016?
d) If Drake is unwilling to issue any new shares to support the
growth, what will be
the debt ratio at the end of 2016?
Homework Answers

Add Answer to:
a) Discuss the process of preparing a financial plan. b) What is the implied level of assets at the end of 2016? c) If t...
1. The table given below summarizes the 2019 income statement and end-year balance sheet of Drake’s Bowling Alleys. Drake’s financial manager forecasts a 10% increase in sales and costs in 2020. The r...
1. The table given below summarizes the 2019 income statement and end-year balance sheet of Drake’s Bowling Alleys. Drake’s financial manager forecasts a 10% increase in sales and costs in 2020. The ratio of sales to average assets is expected to remain at 0.40. Interest is forecasted at 5% of debt at the start of the year. At the end of 2018 debt was $2,400,000 and assets were $6,960,000. (10 points) Income Statement $ in thousands Sales $ 2,900 (40%...
e following tables summarizes the 2019 income statement and end-year balance sheet of Drake's Bowling Alleys....
 e following tables summarizes the 2019 income statement and end-year balance sheet of Drake's Bowling Alleys. Drake nager forecasts a 15% increase in sales and costs in 2020. The ratio of sales to average assets is expected to remain at erest is forecasted at 3% of debt at the start of the year. Sales Costs Interest Pretax profit Tax Net income INCOME STATEMENT, 2019 (Figures in $ thousands) $1,800 (50% of average assets) 900 (50% of sales) 18 (3% of...
ne saved CILJUDI Check my work Problem 4-7 Financial Ratios (LO3) Here are simplified financial statements...
 ne saved CILJUDI Check my work Problem 4-7 Financial Ratios (LO3) Here are simplified financial statements for Phone Corporation in a recent year: points eBook INCOME STATEMENT (Figures in $ millions) Net sales Cost of goods sold Other expenses Depreciation Earnings before interest and taxes (EBIT) Interest expense Income before tax Taxes (at 35%) Net income Dividends $ 13,700 4,360 4,047 2,698 $ 2,595 715 $ 1,880 658 $ 1,222 $ 916 Print References BALANCE SHEET (Figures in $ millions)...
Here are simplified financial statements for Phone Corporation in a recent year: INCOME STATEMENT (Figures in...
 Here are simplified financial statements for Phone Corporation in a recent year: INCOME STATEMENT (Figures in $ millions) Net sales Cost of goods sold Other expenses Depreciation Earnings before interest and taxes (EBIT) Interest expense Income before tax Taxes (at 30%) Net income Dividends $ 14,100 4,560 4,217 2,818 $ 2,505 735 $ 1,770 531 $ 1,239 $ 976 BALANCE SHEET (Figures in $ millions) End of Year Start of Year $ 99 2,882 237 917 $ 4,135 20,073 4,316...
Here are simplified financial statements for Phone Corporation in a recent year: INCOME STATEMENT (Figures in...
 Here are simplified financial statements for Phone Corporation in a recent year: INCOME STATEMENT (Figures in s millions) Net sales Cost of goods sold Other expenses Depreciation Earnings before interest and taxes (EBIT) Interest expense Income before tax Taxes (at 30%) Net income Dividends $ 12,500 3,710 4,112 2,308 $ 2,370 650 $ 1,720 516 1,204 $ 806 BALANCE SHEET (Figures in millions) End of Year Start of Year Assets 82 151 2,350 203 897 $ 3,098 3,601 19,845 3,700...
Here are simplified financial statements for Phone Corporation in a recent year: INCOME STATEMENT (Figures in...
 Here are simplified financial statements for Phone Corporation in a recent year: INCOME STATEMENT (Figures in $ millions) $ 12,200 3,560 Net sales Cost of goods sold Other expenses Depreciation Earnings before interest and taxes (EBIT) Interest expense 4,037 2,218 $ 2,385 635 $ 1,750 Income before tax Taxes (at 30%) 525 $ 1,225 Net income Dividends 746 BALANCE SHEET (Figures in $ millions) End of Start of Year Year Assets Cash and marketable securities 79 148 Receivables 1,882 2,290...
Here are simplified financial statements for Phone Corporation in a recent year: INCOME STATEMENT (Figures in...
Here are simplified financial statements for Phone Corporation in a recent year: INCOME STATEMENT (Figures in $ millions) Net sales $ 13,500 Cost of goods sold 4,260 Other expenses 4,147 Depreciation 2,638 Earnings before interest and taxes (EBIT) $ 2,455 Interest expense 705 Income before tax $ 1,750 Taxes (at 30%) 525 Net income $ 1,225 Dividends $ 896 BALANCE SHEET (Figures in $ millions) End of Year Start of Year Assets Cash and marketable securities $ 93 $...
Here are simplified financial statements for Phone Corporation in a recent year: INCOME STATEMENT (Figures in...
Here are simplified financial statements for Phone Corporation in a recent year: INCOME STATEMENT (Figures in $ millions) Net sales $ 13,200 Cost of goods sold 4,110 Other expenses 4,072 Depreciation 2,548 Earnings before interest and taxes (EBIT) $ 2,470 Interest expense 690 Income before tax $ 1,780 Taxes (at 35%) 623 Net income $ 1,157 Dividends $ 866 BALANCE SHEET (Figures in $ millions) End of Year Start of Year Assets Cash and marketable securities $ 90 $...
Here are simplified financial statements for Phone Corporation in a recent year:INCOME STATEMENT(Figures in $ millions...
Here are simplified financial statements for Phone Corporation in a recent year:INCOME STATEMENT(Figures in $ millions Net sales$12,600 Cost of goods sold3,700 Other expenses4,127 Depreciation2,338 Earnings before interest and taxes (EBIT)$2,375 Interest expense 655 Income before tax$1,720 Taxes (at 35%)602 Net income$1,118 Dividends$816 BALANCE SHEET(Figures in $ millions)End of YearStart ofYearAssets End of year start of the year Cash and marketable securities $83 $152 Receivables 2,082 2,370 Inventories 157 208 Other current assets 837 902 Total current assets 3,159 3,632...
Presented below is financial data for the Forrester company as of year-end 2012 and 2013 1...
 Presented below is financial data for the Forrester company as of year-end 2012 and 2013 1 2012 2013 Current Assets 338,000 355,000 Total Assets 123,000 170,000 Current liabilities/29,000 73,000 Tutal liabilities/72,000 115,000 Net saics 132,000 190,000 Net income 117,500 128,200 calculate Forrester's Corrent ratio debt-to-total-assets ratio,& return on sales ratio. 2012 2013 Corrent ratio Debt-to-assets ratio Return on sales ratio
 e following tables summarizes the 2019 income statement and end-year balance sheet of Drake's Bowling Alleys. Drake nager forecasts a 15% increase in sales and costs in 2020. The ratio of sales to average assets is expected to remain at erest is forecasted at 3% of debt at the start of the year. Sales Costs Interest Pretax profit Tax Net income INCOME STATEMENT, 2019 (Figures in $ thousands) $1,800 (50% of average assets) 900 (50% of sales) 18 (3% of...
 ne saved CILJUDI Check my work Problem 4-7 Financial Ratios (LO3) Here are simplified financial statements for Phone Corporation in a recent year: points eBook INCOME STATEMENT (Figures in $ millions) Net sales Cost of goods sold Other expenses Depreciation Earnings before interest and taxes (EBIT) Interest expense Income before tax Taxes (at 35%) Net income Dividends $ 13,700 4,360 4,047 2,698 $ 2,595 715 $ 1,880 658 $ 1,222 $ 916 Print References BALANCE SHEET (Figures in $ millions)...
 Here are simplified financial statements for Phone Corporation in a recent year: INCOME STATEMENT (Figures in $ millions) Net sales Cost of goods sold Other expenses Depreciation Earnings before interest and taxes (EBIT) Interest expense Income before tax Taxes (at 30%) Net income Dividends $ 14,100 4,560 4,217 2,818 $ 2,505 735 $ 1,770 531 $ 1,239 $ 976 BALANCE SHEET (Figures in $ millions) End of Year Start of Year $ 99 2,882 237 917 $ 4,135 20,073 4,316...
 Here are simplified financial statements for Phone Corporation in a recent year: INCOME STATEMENT (Figures in s millions) Net sales Cost of goods sold Other expenses Depreciation Earnings before interest and taxes (EBIT) Interest expense Income before tax Taxes (at 30%) Net income Dividends $ 12,500 3,710 4,112 2,308 $ 2,370 650 $ 1,720 516 1,204 $ 806 BALANCE SHEET (Figures in millions) End of Year Start of Year Assets 82 151 2,350 203 897 $ 3,098 3,601 19,845 3,700...
 Here are simplified financial statements for Phone Corporation in a recent year: INCOME STATEMENT (Figures in $ millions) $ 12,200 3,560 Net sales Cost of goods sold Other expenses Depreciation Earnings before interest and taxes (EBIT) Interest expense 4,037 2,218 $ 2,385 635 $ 1,750 Income before tax Taxes (at 30%) 525 $ 1,225 Net income Dividends 746 BALANCE SHEET (Figures in $ millions) End of Start of Year Year Assets Cash and marketable securities 79 148 Receivables 1,882 2,290...
 Presented below is financial data for the Forrester company as of year-end 2012 and 2013 1 2012 2013 Current Assets 338,000 355,000 Total Assets 123,000 170,000 Current liabilities/29,000 73,000 Tutal liabilities/72,000 115,000 Net saics 132,000 190,000 Net income 117,500 128,200 calculate Forrester's Corrent ratio debt-to-total-assets ratio,& return on sales ratio. 2012 2013 Corrent ratio Debt-to-assets ratio Return on sales ratio
Most questions answered within 3 hours.
-
Question Three
Suppose you as project manager are using the Waterfall
development methodology on a large...
asked 16 minutes ago -
Which statement is not true about welfare in Canada?
A.Benefits typically vary based on one's ability...
asked 48 minutes ago -
Please help me with FLOWCHART and UML diagram for class,
thank you!
#include <iostream>
#include <fstream>...
asked 1 hour ago -
3. Describe the “logic circuit” of the Lac operon. Which
proteins are bound or not to...
asked 1 hour ago -
Ayesha’s adjusted gross income is $60,000 in 2019. She donated a
piece of artwork with a...
asked 1 hour ago -
For Dijkstra’s shortest path algorithm:
a. Give the Big-O time for Dijkstra’s shortest path algorithm
and...
asked 1 hour ago -
Phosphorus violates the 'octet rule' in biological molecules,
forming more covalent bonds than expected based on...
asked 1 hour ago -
A 1.3 eV electron has a 10-4 probability of tunneling
through a 2.4 eV potential barrier....
asked 2 hours ago -
What is the one ingredient that is common to being successful
with all stakeholders?
profit
trust...
asked 2 hours ago -
Write an assembly language 32 bit program that reads in lines of
text by a .txt...
asked 2 hours ago -
what is the density ( in g/L) of hydrogen gas at 29 degrees C and a...
asked 2 hours ago -
5-6. You are considering three investment alternatives for some
spare cash: Old Reliable Corporation stock (A1),...
asked 2 hours ago