
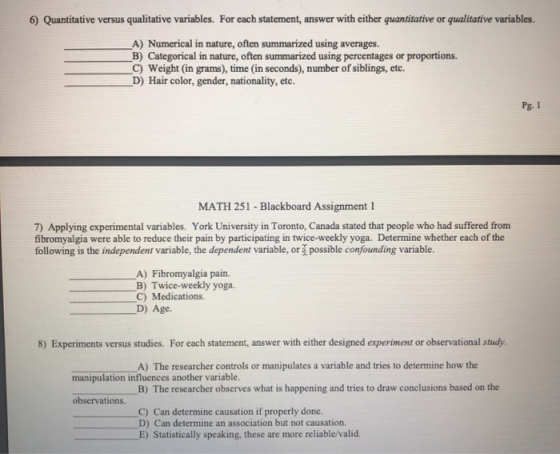


6) Quantitative versus qualitative variables. For each statement, answer with either quantitative or qualitative variables. A) Numerical in nature, often summarized using averages. B) Categorical in nature, often summarized using percentages or proportions. C) Weight (in grams), time (in seconds), number of siblings, etc. D) Hair color, gender, nationality, etc. Pg. 1 MATH 251 Blackboard Assignment 1 7) Applying experimental variables. York University in Toronto, Canada stated that people who had suffered from fibromyalgia were able to reduce their pain by participating in twice-weekly yoga. Determine whether each of the following is the independent variable, the dependent variable, or possible confounding variable. A) Fibromyalgia pain. B) Twice-weekly yoga. C) Medications. D) Age. 8) Experiments versus studies. For each statement, answer with either designed experiment or observational study. A) The researcher controls or manipulates a variable and tries to determine how the manipulation influences another variable. B) The researcher observes what is happening and tries to draw conclusions based on the observations C) Can determine causation if properly done. D) Can determine an association but not causation. E) Statistically speaking, these are more reliable/valid.
9) Defining sampling methods. For each statement, answer with either simple-random, systematic, cluster, stratified, or convenience A) You group the population and collect a simple-random sample from every group B) The ideal sample (i.e. most reliable). Every member has an equal chance of being sampled C) The least reliable sample, it is not random and has the highest potential of bias. D) You group the population and sample every member of randomly chosen groups. E) You randomly choose a starting member and then sample every k member. 10) Identifying the sampling method. For each statement, answer with either simple-random, systematic, cluster, stratified, or convenience. A) A group of students ask every 10th person from the school's student registry about how they feel about the parking on campus starting with the 4th person who they chose randomly. B) Levodopa is a drug used to help control the symptoms of Parkinson's disease. Doctors wish to choose 80 out of 200 patients with Parkinson's disease to test the effectiveness of Levodopa. They assign each patient a number from 1 to 200. They then choose 80 nubers using a random number table. C) A chemist divides a group of flasks of acids and bases into 7 categories based on pH. She then takes a simple random sample from each of the 7 categories in order to use in an experiment. D) A florist sells roses by the dozen and currently has 120 roses separated in 10 different bunches. She randomly picks 2 bunches and use the 24 roses to determine the average number of petals per rose. E) A student wants to estimate the percentage of her friends that vape. She posts a poll on Twitter and asks her friends to respond.
11) Histograms are very important to identify the 'shape' of a quantitative dataset. A) Which histogram would be described as fairly bell-shaped? B) Which histogram would be described as fairly uniform? C) Which histogram would be described as skewed to the right or skewed positively? 12) Some graphs are appropriate for qualitative data while others are appropriate for quantitative data. For each of the A) Pie chart B) Histogram C) Stem-and-leaf plot D) Frequency polygorn E) Pareto F) Cumulative frequency distribution 13) Explain why the following bar graph is misleading and how you would fix it. Effectivepess of Allergy Medicines 30.7 0.5 за 4 0.3 Pellaway Happajoy
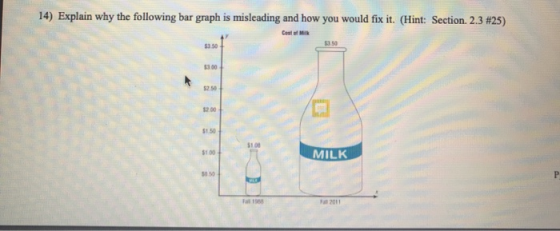
14) Explain why the following bar graph is misleading and how you would fix it. (Hint: Section. 2.3 #25) $3.00 52.50 $2 00 $1 50 51 00 MILK $1 00 0 10 a 1958 Fal 2011
Homework Answers
I can only answer 1 question at a time so I am solving question 2).
2)
A) population
B) sample
C) sample
D) population
E) sample
Please do rate me and mention doubts in the comments section.
Add Answer to:
2) Populations versus samples. For each statement, answer with either population, sample, or both. A) The compl...
Explain how populations and samples differ Choose the correct answer below ( A. A sample is...
 Explain how populations and samples differ Choose the correct answer below ( A. A sample is a set of measurements that are recorded on a naturally occurring numerical scale. A population is a set of measurements that cannot be measured on 0 B. O C. ( D. a natural numerical scale; they can only be classified into one of a group of categories A population is a set of units of interest to a study. A sample is a subset...
9.6 in order to compare the means of two populations, inde- NW pendent random samples of 400 observations are selected from each population, with the following results Sample 1 Sample 2 $.240 s2 200...
 9.6 in order to compare the means of two populations, inde- NW pendent random samples of 400 observations are selected from each population, with the following results Sample 1 Sample 2 $.240 s2 200 5,275 1150 a. Use a 95% confidence interval to estimate the dif- ference between the population means (μ,-μ Interpret the confidence interval. b. Test the null hypothesis Ho (μι-μ)--0 versus the c. Suppose the test in part b were conducted with the d. Test thenull hypothesis...
uctions: Show all your work for each of the problems to obtain partial credits I. Identification...
 uctions: Show all your work for each of the problems to obtain partial credits I. Identification Questions (1) Identify the type of data (Qualitative or Quantitative), if quantitative, continus or the level (nominal, ordinal, interval, ratio) of measurement most suitable in el Description Qualitative Quantitative Discrete/Continnous Measurment (a) The type of cars in the parking lot (b) The height of students in our c The ages in years of current LIU professors (d) The final scores of every game the...
Multiple Choices 4. the best way to form a cluster of 20 samples from a population...
Multiple Choices 4. the best way to form a cluster of 20 samples from a population measuring 320: a. all members of the population are written in pieces of paper and then put in a box. Twenty pieces of paper were selected from the box b. all population members are written in the alphabetical list. the first sixteen parts of the list are taken randomly and become members of the population. Then each 16th name in the list of members...
Need help with question 65! information to answer the next two exercis0s e duration (amount of...
 Need help with question 65!
information to answer the next two exercis0s e duration (amount of time) of resident A study was done to determine the age, number of times pe use of a local park in San Jose. The first house in the neighborhood around the park then every 8th house in the neighborhood around the park was interviewed 63. "Number of times per weok" is what type of data? a qualitative Quantitative discrote c. quantitative continuous 64. "Duration...
Need help with question 65!
information to answer the next two exercis0s e duration (amount of time) of resident A study was done to determine the age, number of times pe use of a local park in San Jose. The first house in the neighborhood around the park then every 8th house in the neighborhood around the park was interviewed 63. "Number of times per weok" is what type of data? a qualitative Quantitative discrote c. quantitative continuous 64. "Duration...
NEED HELP ASAP Please answer all please. a People with higher incomes might not own TVs or computers with higher incomes likely will have high-speed Internet access, which will lead to spending...
 NEED HELP ASAP Please answer all please.
a People with higher incomes might not own TVs or computers with higher incomes likely will have high-speed Internet access, which will lead to spending more time on-i O People with lower incomes might not own TVs or computers. D People who spend time at home on the Internet never watch TV r the students in your statistics class as the population and suppose they are seated in four rows of 10 comes...
NEED HELP ASAP Please answer all please.
a People with higher incomes might not own TVs or computers with higher incomes likely will have high-speed Internet access, which will lead to spending more time on-i O People with lower incomes might not own TVs or computers. D People who spend time at home on the Internet never watch TV r the students in your statistics class as the population and suppose they are seated in four rows of 10 comes...
1. For each of the following random variables, determine whether the variable is quantitative or qualitative....
 1. For each of the following random variables, determine whether the variable is quantitative or qualitative. Further classify those variables as discrete/continuous or ordinal/nominal (a) Number of telephones per householod (b) Whether there is a fax machine in the household (c) Length (in minutes) of longest local call per month (d) Total time spent on online purchases in a month (e) Educational level of a person 2. It is believed that exercising can lower blood pressure. A medical researcher who...
select the correct answer 1) Which statement about systematic reviews is true? a) All systematic reviews...
select the correct answer 1) Which statement about systematic reviews is true? a) All systematic reviews of quantitative studies are meta-analyses. b) “Systematic review” is just another name for a literature review. c) All systematic reviews of quantitative studies are metasyntheses. d) Systematic reviews follow similar “rules” as for primary studies. 2) Which is the unit of analysis in a meta-analysis? a) Prior systematic reviews b) A primary qualitative study c) Individual study participants d) A primary quantitative study 3)...
For each of the studies in #1 through #4, answer the following questions a)What is the...
 For each of the studies in #1 through #4, answer the following questions a)What is the response variable? b)What is the study unit? c) What are the factor(s)? For each factor, give the corresponding factor levels. d)Ifit is a multi-factor study, list the treatments. e) Is the study experimental, observational or mixed? Why? Explain in terms of the factors. 1.In a study to determine if proficiency test scores are affected by the education of a child's parents, a random sample...
For each of the studies in #1 through #4, answer the following questions a)What is the...
 For each of the studies in #1 through #4, answer the following questions a)What is the response variable? b)What is the study unit? c)What are the factor(s)? For each factor, give the corresponding factor levels. d)Ifit is a multi-factor study, list the treatments. e) Is the study experimental, observational or mixed? Why? Explain in terms of the factors In a study to determine if proficiency test scores are affected by the education of a child's parents, a random sample of...
 Explain how populations and samples differ Choose the correct answer below ( A. A sample is a set of measurements that are recorded on a naturally occurring numerical scale. A population is a set of measurements that cannot be measured on 0 B. O C. ( D. a natural numerical scale; they can only be classified into one of a group of categories A population is a set of units of interest to a study. A sample is a subset...
 9.6 in order to compare the means of two populations, inde- NW pendent random samples of 400 observations are selected from each population, with the following results Sample 1 Sample 2 $.240 s2 200 5,275 1150 a. Use a 95% confidence interval to estimate the dif- ference between the population means (μ,-μ Interpret the confidence interval. b. Test the null hypothesis Ho (μι-μ)--0 versus the c. Suppose the test in part b were conducted with the d. Test thenull hypothesis...
 uctions: Show all your work for each of the problems to obtain partial credits I. Identification Questions (1) Identify the type of data (Qualitative or Quantitative), if quantitative, continus or the level (nominal, ordinal, interval, ratio) of measurement most suitable in el Description Qualitative Quantitative Discrete/Continnous Measurment (a) The type of cars in the parking lot (b) The height of students in our c The ages in years of current LIU professors (d) The final scores of every game the...
 Need help with question 65!
information to answer the next two exercis0s e duration (amount of time) of resident A study was done to determine the age, number of times pe use of a local park in San Jose. The first house in the neighborhood around the park then every 8th house in the neighborhood around the park was interviewed 63. "Number of times per weok" is what type of data? a qualitative Quantitative discrote c. quantitative continuous 64. "Duration...
Need help with question 65!
information to answer the next two exercis0s e duration (amount of time) of resident A study was done to determine the age, number of times pe use of a local park in San Jose. The first house in the neighborhood around the park then every 8th house in the neighborhood around the park was interviewed 63. "Number of times per weok" is what type of data? a qualitative Quantitative discrote c. quantitative continuous 64. "Duration...
 NEED HELP ASAP Please answer all please.
a People with higher incomes might not own TVs or computers with higher incomes likely will have high-speed Internet access, which will lead to spending more time on-i O People with lower incomes might not own TVs or computers. D People who spend time at home on the Internet never watch TV r the students in your statistics class as the population and suppose they are seated in four rows of 10 comes...
NEED HELP ASAP Please answer all please.
a People with higher incomes might not own TVs or computers with higher incomes likely will have high-speed Internet access, which will lead to spending more time on-i O People with lower incomes might not own TVs or computers. D People who spend time at home on the Internet never watch TV r the students in your statistics class as the population and suppose they are seated in four rows of 10 comes...
 1. For each of the following random variables, determine whether the variable is quantitative or qualitative. Further classify those variables as discrete/continuous or ordinal/nominal (a) Number of telephones per householod (b) Whether there is a fax machine in the household (c) Length (in minutes) of longest local call per month (d) Total time spent on online purchases in a month (e) Educational level of a person 2. It is believed that exercising can lower blood pressure. A medical researcher who...
 For each of the studies in #1 through #4, answer the following questions a)What is the response variable? b)What is the study unit? c) What are the factor(s)? For each factor, give the corresponding factor levels. d)Ifit is a multi-factor study, list the treatments. e) Is the study experimental, observational or mixed? Why? Explain in terms of the factors. 1.In a study to determine if proficiency test scores are affected by the education of a child's parents, a random sample...
 For each of the studies in #1 through #4, answer the following questions a)What is the response variable? b)What is the study unit? c)What are the factor(s)? For each factor, give the corresponding factor levels. d)Ifit is a multi-factor study, list the treatments. e) Is the study experimental, observational or mixed? Why? Explain in terms of the factors In a study to determine if proficiency test scores are affected by the education of a child's parents, a random sample of...
Most questions answered within 3 hours.
-
A roads department wants to capitalize annual maintenance fees
of $5 million. It applies to the...
asked 25 seconds ago -
Question 6 (1 point) Landmark Coal operates a mine. During July,
the company obtained 500 tons...
asked 4 minutes ago -
A 4.0 cm -tall object is 10 cm in front of a converging lens
that has...
asked 2 minutes ago -
Chase is currently trading at $66.02. Analysts predict that
there is a 20 % probability that...
asked 16 minutes ago -
Calculate the amount of heat needed to boil 120.g of
acetic acid (HCH3CO2), beginning from a temperature...
asked 24 minutes ago -
What conservation laws are involved in the computation
of the initial velocity of a projectile using...
asked 39 minutes ago -
Suppose that the following is an internal node of a B+ tree.
Which pointer is the...
asked 46 minutes ago -
If you have 140. mL of a 0.100
M MOPS buffer at pH 7.20 and you...
asked 1 hour ago -
Assume that the economy is characterized by the following
behavioral equations
C = 160 + 0.6YD...
asked 1 hour ago -
Suppose that the first national bank currently holds a total of
37 million dollars in deposits...
asked 1 hour ago -
A proton is released from rest in a uniform electric field of
magnitude 1.27E+5 N/C. Calculate...
asked 1 hour ago -
Let's say you want to poll a random sample of 150 students on
campus to see...
asked 1 hour ago