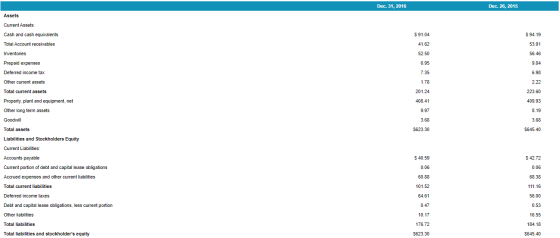
Using data available in the case, calculate the annual growth rate from 2014 to 2015, and from 2015 to 2016 (in percentages). All calculations should be rounded to one decimal (e.g., 12.7%)

I need help filling in these percentages.

Homework Answers


Balance sheet data is provided for 2015 & 2016 only, hence the growth is calculated for 2015-16 period only.
Add Answer to:
Using data available in the case, calculate the annual growth rate from 2014 to 2015, and from 2015 to 2016 (in percenta...
Prepare common-size statements in the framework provided? 2014 Coca-Cola 2015 2016 2017 2018 2014 Pepsi 2015...
 Prepare common-size statements in the framework provided?
2014 Coca-Cola 2015 2016 2017 2018 2014 Pepsi 2015 2016 2017 2018 45.9 44.5 42.0 32.1 66.71 11.8 179 30.9 63.5 28.8 28.2 64.7 29.4 33.3 Sales Cost of Revenue Gross Profit Operating Expenses Operating Profit Non-operating income 100 25.2 10.1 EBIT Interest solo EBT Taxes Net Income 4.9 | 2015 2016 2017 2018 2014 2015 2016 2017 2018 ASSETS 20 16.0 16.1 3 6.7 70 7.1 2.7 3.1 1.56 8.7 L 12.0...
Prepare common-size statements in the framework provided?
2014 Coca-Cola 2015 2016 2017 2018 2014 Pepsi 2015 2016 2017 2018 45.9 44.5 42.0 32.1 66.71 11.8 179 30.9 63.5 28.8 28.2 64.7 29.4 33.3 Sales Cost of Revenue Gross Profit Operating Expenses Operating Profit Non-operating income 100 25.2 10.1 EBIT Interest solo EBT Taxes Net Income 4.9 | 2015 2016 2017 2018 2014 2015 2016 2017 2018 ASSETS 20 16.0 16.1 3 6.7 70 7.1 2.7 3.1 1.56 8.7 L 12.0...
Nordstrom, Inc. Consolidated Statements of Earnings For Fiscal Years Ended ($ millions) 2016 2015 2014 Net...
 Nordstrom, Inc. Consolidated Statements of Earnings For Fiscal Years Ended ($ millions) 2016 2015 2014 Net Sales $14,095 $13,110 $12,166 Credit card revenues 342 396 374 Total revenues 14,437 13,506 12,540 Cost of sales and related buying and occupancy costs (9,168) (8,406) (7.737) Selling, general and administrative expenses (4,168) (3,777) (3,453) Earnings before interest and income taxes 1,101 1,323 1,350 Interest expense, net (125) (138) (161) Earnings before income taxes 976 1,185 1,189 Income tax expense (376) (465) (455) Net...
x x B . IF Dec 31, 2015 Dec 31, 2014 $ 1,972 1,465 2,020 $...
 x x B . IF Dec 31, 2015 Dec 31, 2014 $ 1,972 1,465 2,020 $ 2,088 1,217 2,297 119 379 318 925 534 318 1,987 1,078 796 701 Consolidated Balance Sheets - USD ($) $ in Millions 2 Current Assets: 3 Cash and cash equivalents 4 Short-term investments Accounts receivable, net of an allowance for uncollectible accounts of $9 and $11 at December 31, 5 2015 and 2014, respectively 6 Hedge margin receivable 7 Fuel inventory Expendable parts and...
Using the following information: Calculate the following ratios for Urban Outfitters for both 2016 and 2017...
 Using the following information:
Calculate the following ratios for Urban Outfitters for
both 2016 and
2017 (show calculations):
a. Gross profit margin
b. Operating profit margin
c. Net profit margin
d. Times interest earned coverage
e. Return on shareholders’ equity
f. Return on assets
g. Debt-to-equity ratio
h. Days of inventory
i. Inventory turnover ratio
j. Average collection period
Consolidated Income Statements for Urban ters, Inc. 2016 2017 $3.545.794 $3,445,134 Net sales (total revenue) 2,301,181 2,243,232 Cost of sales 906,086...
Using the following information:
Calculate the following ratios for Urban Outfitters for
both 2016 and
2017 (show calculations):
a. Gross profit margin
b. Operating profit margin
c. Net profit margin
d. Times interest earned coverage
e. Return on shareholders’ equity
f. Return on assets
g. Debt-to-equity ratio
h. Days of inventory
i. Inventory turnover ratio
j. Average collection period
Consolidated Income Statements for Urban ters, Inc. 2016 2017 $3.545.794 $3,445,134 Net sales (total revenue) 2,301,181 2,243,232 Cost of sales 906,086...
Part 1 Calculate the growth in the following accounts from December 31, 2015, to January 1,...
 Part 1 Calculate the growth in the following accounts from December 31, 2015, to January 1, 2017: (Round answers to 1 decimal place, e.g. 52.7%.) i. Revenue % ii. Cost of Sales % iii. Net Earnings % iv. Total Assets % V. Total Equity % Winnipeg-based New Flyer Industries Inc. is one of North America's largest manufacturers of heavy-duty transit buses. Excerpts from its 2016 financial statements are in Exhibits 2.20A and 2.20B. EXHIBIT 2.20A New Flyer Industries Inc.'s 2016...
Dec 31, 2015 Dec. 31, 2014 $ 1,972 1,465 2,020 $ 2,088 1,217 2,297 119 925...
 Dec 31, 2015 Dec. 31, 2014 $ 1,972 1,465 2,020 $ 2,088 1,217 2,297 119 925 379 534 318 318 1,987 1,078 796 701 Consolidated Balance Sheets - USD ($) $ in Millions 2 Current Assets: 3 Cash and cash equivalents 4 Short-term investments Accounts receivable, net of an allowance for uncollectible accounts of $9 and $11 at 5 December 31, 2015 and 2014, respectively 6 Hedge margin receivable 7 Fuel inventory Expendable parts and supplies inventories, net of an...
A. Compute net nonoperating expenses (NNE) for 2016 and 2015. Assume that combined federal and st...
 a. Compute net nonoperating expenses (NNE) for 2016 and 2015.
Assume that combined federal and state statutory tax rate is 37%
for both fiscal years
b. Compute net nonoperating obligations (NNO) for 2016 and
2015
Income statements and balance sheets follow for Snap-On Incorporated. Refer to these financial statements to answer the requirements SNAP-ON INCORPORATED Consolidated Statements of Earnings (Amounts in millions) For the fiscal vear ended Net sales Cost of goods sold Gross profit Operating expenses 2016 $3,430.4 (1,720.8...
a. Compute net nonoperating expenses (NNE) for 2016 and 2015.
Assume that combined federal and state statutory tax rate is 37%
for both fiscal years
b. Compute net nonoperating obligations (NNO) for 2016 and
2015
Income statements and balance sheets follow for Snap-On Incorporated. Refer to these financial statements to answer the requirements SNAP-ON INCORPORATED Consolidated Statements of Earnings (Amounts in millions) For the fiscal vear ended Net sales Cost of goods sold Gross profit Operating expenses 2016 $3,430.4 (1,720.8...
Reformulate Carrefour’s 2015 consolidated income statement (I/S), 2014 and 2015 statements of financial positions (SFP; i.e.,...
 Reformulate Carrefour’s 2015 consolidated income statement
(I/S),
2014 and 2015 statements of financial positions (SFP; i.e.,
balance sheets),
and 2015 statement of cash flows (SCF)
.
Carrefour 31 December Reported VS 2015 2014 2013 2015 2014 Year ended 31 December Continuing operations Other revenue Total revenue Cost of Sales Gross margin from recurring operations Sales, general and administrative expenses, depreciation and amort Recurring operating profit Net income from companies accounted for by the equity method Recurring operating income after net...
Reformulate Carrefour’s 2015 consolidated income statement
(I/S),
2014 and 2015 statements of financial positions (SFP; i.e.,
balance sheets),
and 2015 statement of cash flows (SCF)
.
Carrefour 31 December Reported VS 2015 2014 2013 2015 2014 Year ended 31 December Continuing operations Other revenue Total revenue Cost of Sales Gross margin from recurring operations Sales, general and administrative expenses, depreciation and amort Recurring operating profit Net income from companies accounted for by the equity method Recurring operating income after net...
Forecasting with the Parsimonious Method and Estimating Share Value Using the DCF Model Following are the...
Forecasting with the Parsimonious Method and Estimating Share Value Using the DCF Model Following are the income statement and balance sheet for Cisco Sytems for the year ended July 30, 2016. Cisco Sytems Consolidated Statements of Income Years Ended December ($ millions) July 30, 2016 July 25, 2015 Revenue Product $37,254 $37,750 Service 11,993 11,411 Total revenue 49,247 49,161 Cost of sales Product 14,161 15,377 Service 4,126 4,103 Total cost of sales 18,287 19,480 Gross margin 30,960 29,681 Operating expenses...
1. Using the attached information, calculate for 2015 and 2016 the following: a) Receivables turnover,Inventory turnover,...
 1. Using the attached information, calculate for 2015
and 2016 the following:
a) Receivables turnover,Inventory turnover, and
Payable turnover.
b)Receivables period,Inventory period,and Payable
period.
c)Operating Cycle and Cash Conversion cycle
2. Discuss the changes that took place from 2015 to
2016 and suggest the ways how the company could improve its
performance
Balance Sheets for Years Ended 2014, 2015, and 2016 ASSETS 2014 2015 2016 Cash and marketable securities Receivables Inventories Total current assets Grass plant and equipment less accumulated...
1. Using the attached information, calculate for 2015
and 2016 the following:
a) Receivables turnover,Inventory turnover, and
Payable turnover.
b)Receivables period,Inventory period,and Payable
period.
c)Operating Cycle and Cash Conversion cycle
2. Discuss the changes that took place from 2015 to
2016 and suggest the ways how the company could improve its
performance
Balance Sheets for Years Ended 2014, 2015, and 2016 ASSETS 2014 2015 2016 Cash and marketable securities Receivables Inventories Total current assets Grass plant and equipment less accumulated...
 Prepare common-size statements in the framework provided?
2014 Coca-Cola 2015 2016 2017 2018 2014 Pepsi 2015 2016 2017 2018 45.9 44.5 42.0 32.1 66.71 11.8 179 30.9 63.5 28.8 28.2 64.7 29.4 33.3 Sales Cost of Revenue Gross Profit Operating Expenses Operating Profit Non-operating income 100 25.2 10.1 EBIT Interest solo EBT Taxes Net Income 4.9 | 2015 2016 2017 2018 2014 2015 2016 2017 2018 ASSETS 20 16.0 16.1 3 6.7 70 7.1 2.7 3.1 1.56 8.7 L 12.0...
Prepare common-size statements in the framework provided?
2014 Coca-Cola 2015 2016 2017 2018 2014 Pepsi 2015 2016 2017 2018 45.9 44.5 42.0 32.1 66.71 11.8 179 30.9 63.5 28.8 28.2 64.7 29.4 33.3 Sales Cost of Revenue Gross Profit Operating Expenses Operating Profit Non-operating income 100 25.2 10.1 EBIT Interest solo EBT Taxes Net Income 4.9 | 2015 2016 2017 2018 2014 2015 2016 2017 2018 ASSETS 20 16.0 16.1 3 6.7 70 7.1 2.7 3.1 1.56 8.7 L 12.0...
 Nordstrom, Inc. Consolidated Statements of Earnings For Fiscal Years Ended ($ millions) 2016 2015 2014 Net Sales $14,095 $13,110 $12,166 Credit card revenues 342 396 374 Total revenues 14,437 13,506 12,540 Cost of sales and related buying and occupancy costs (9,168) (8,406) (7.737) Selling, general and administrative expenses (4,168) (3,777) (3,453) Earnings before interest and income taxes 1,101 1,323 1,350 Interest expense, net (125) (138) (161) Earnings before income taxes 976 1,185 1,189 Income tax expense (376) (465) (455) Net...
 x x B . IF Dec 31, 2015 Dec 31, 2014 $ 1,972 1,465 2,020 $ 2,088 1,217 2,297 119 379 318 925 534 318 1,987 1,078 796 701 Consolidated Balance Sheets - USD ($) $ in Millions 2 Current Assets: 3 Cash and cash equivalents 4 Short-term investments Accounts receivable, net of an allowance for uncollectible accounts of $9 and $11 at December 31, 5 2015 and 2014, respectively 6 Hedge margin receivable 7 Fuel inventory Expendable parts and...
 Using the following information:
Calculate the following ratios for Urban Outfitters for
both 2016 and
2017 (show calculations):
a. Gross profit margin
b. Operating profit margin
c. Net profit margin
d. Times interest earned coverage
e. Return on shareholders’ equity
f. Return on assets
g. Debt-to-equity ratio
h. Days of inventory
i. Inventory turnover ratio
j. Average collection period
Consolidated Income Statements for Urban ters, Inc. 2016 2017 $3.545.794 $3,445,134 Net sales (total revenue) 2,301,181 2,243,232 Cost of sales 906,086...
Using the following information:
Calculate the following ratios for Urban Outfitters for
both 2016 and
2017 (show calculations):
a. Gross profit margin
b. Operating profit margin
c. Net profit margin
d. Times interest earned coverage
e. Return on shareholders’ equity
f. Return on assets
g. Debt-to-equity ratio
h. Days of inventory
i. Inventory turnover ratio
j. Average collection period
Consolidated Income Statements for Urban ters, Inc. 2016 2017 $3.545.794 $3,445,134 Net sales (total revenue) 2,301,181 2,243,232 Cost of sales 906,086...
 Part 1 Calculate the growth in the following accounts from December 31, 2015, to January 1, 2017: (Round answers to 1 decimal place, e.g. 52.7%.) i. Revenue % ii. Cost of Sales % iii. Net Earnings % iv. Total Assets % V. Total Equity % Winnipeg-based New Flyer Industries Inc. is one of North America's largest manufacturers of heavy-duty transit buses. Excerpts from its 2016 financial statements are in Exhibits 2.20A and 2.20B. EXHIBIT 2.20A New Flyer Industries Inc.'s 2016...
 Dec 31, 2015 Dec. 31, 2014 $ 1,972 1,465 2,020 $ 2,088 1,217 2,297 119 925 379 534 318 318 1,987 1,078 796 701 Consolidated Balance Sheets - USD ($) $ in Millions 2 Current Assets: 3 Cash and cash equivalents 4 Short-term investments Accounts receivable, net of an allowance for uncollectible accounts of $9 and $11 at 5 December 31, 2015 and 2014, respectively 6 Hedge margin receivable 7 Fuel inventory Expendable parts and supplies inventories, net of an...
 a. Compute net nonoperating expenses (NNE) for 2016 and 2015.
Assume that combined federal and state statutory tax rate is 37%
for both fiscal years
b. Compute net nonoperating obligations (NNO) for 2016 and
2015
Income statements and balance sheets follow for Snap-On Incorporated. Refer to these financial statements to answer the requirements SNAP-ON INCORPORATED Consolidated Statements of Earnings (Amounts in millions) For the fiscal vear ended Net sales Cost of goods sold Gross profit Operating expenses 2016 $3,430.4 (1,720.8...
a. Compute net nonoperating expenses (NNE) for 2016 and 2015.
Assume that combined federal and state statutory tax rate is 37%
for both fiscal years
b. Compute net nonoperating obligations (NNO) for 2016 and
2015
Income statements and balance sheets follow for Snap-On Incorporated. Refer to these financial statements to answer the requirements SNAP-ON INCORPORATED Consolidated Statements of Earnings (Amounts in millions) For the fiscal vear ended Net sales Cost of goods sold Gross profit Operating expenses 2016 $3,430.4 (1,720.8...
 Reformulate Carrefour’s 2015 consolidated income statement
(I/S),
2014 and 2015 statements of financial positions (SFP; i.e.,
balance sheets),
and 2015 statement of cash flows (SCF)
.
Carrefour 31 December Reported VS 2015 2014 2013 2015 2014 Year ended 31 December Continuing operations Other revenue Total revenue Cost of Sales Gross margin from recurring operations Sales, general and administrative expenses, depreciation and amort Recurring operating profit Net income from companies accounted for by the equity method Recurring operating income after net...
Reformulate Carrefour’s 2015 consolidated income statement
(I/S),
2014 and 2015 statements of financial positions (SFP; i.e.,
balance sheets),
and 2015 statement of cash flows (SCF)
.
Carrefour 31 December Reported VS 2015 2014 2013 2015 2014 Year ended 31 December Continuing operations Other revenue Total revenue Cost of Sales Gross margin from recurring operations Sales, general and administrative expenses, depreciation and amort Recurring operating profit Net income from companies accounted for by the equity method Recurring operating income after net...
 1. Using the attached information, calculate for 2015
and 2016 the following:
a) Receivables turnover,Inventory turnover, and
Payable turnover.
b)Receivables period,Inventory period,and Payable
period.
c)Operating Cycle and Cash Conversion cycle
2. Discuss the changes that took place from 2015 to
2016 and suggest the ways how the company could improve its
performance
Balance Sheets for Years Ended 2014, 2015, and 2016 ASSETS 2014 2015 2016 Cash and marketable securities Receivables Inventories Total current assets Grass plant and equipment less accumulated...
1. Using the attached information, calculate for 2015
and 2016 the following:
a) Receivables turnover,Inventory turnover, and
Payable turnover.
b)Receivables period,Inventory period,and Payable
period.
c)Operating Cycle and Cash Conversion cycle
2. Discuss the changes that took place from 2015 to
2016 and suggest the ways how the company could improve its
performance
Balance Sheets for Years Ended 2014, 2015, and 2016 ASSETS 2014 2015 2016 Cash and marketable securities Receivables Inventories Total current assets Grass plant and equipment less accumulated...
Most questions answered within 3 hours.
-
Calculate the number density of argon gas at a temperature of
24C and a pressure of...
asked 30 minutes ago -
Alternative
Classification
How to Estimate
Probabilities from Data? ( For continuous Attributes)
And How to generate...
asked 33 minutes ago -
An explosion breaks a 20.0-kg object into three parts. The
object is initially moving at a...
asked 1 hour ago -
Calculate the approximate number of residues of Rubisco, which
is involved in carbon fixation in plants,...
asked 2 hours ago -
Other decisions about scientific claims can have a much broader
impact.ENERGYarrow-10x10.png, environment, health, security - all...
asked 3 hours ago -
I need to write a research paper and work cited about this
topic: The United States...
asked 3 hours ago -
Hello! I was wondering if I could have some help?
If the vapor pressure of carvone...
asked 4 hours ago -
An economist wants to estimate the mean per capita income (in
thousands of dollars) for a...
asked 4 hours ago -
What would be the input/output characteristic of a circuit
obtained by putting two of your 2's-complementers...
asked 4 hours ago -
In Drosophila, the transition from the syncytial blastoderm
stage to the cellular blastoderm stage is a...
asked 4 hours ago -
Project management question:
Name 3 different types of resources (hint: humans are one
type)
asked 5 hours ago -
Consider the following reaction: C 2H 2( g) + 2H 2( g) C 2H 6(
g)...
asked 5 hours ago