Question
for question c, the options for the first two pull down's are
- many observations
-only two observations
and for the third pull down the options are
-more reliable
-easier to calculate
Homework Answers
Answer #1
(a)
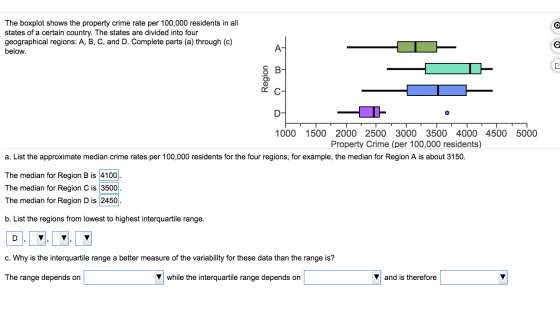
(i) The median for Region B is 4100
(ii) The median for Region C is 3500
(iii) The median for Region D is 2450
(b)
Interquartile Rage for Region A = 3600 - 2900 = 700
Interquartile Rage for Region B = 4250 - 3300 = 950
Interquartile Rage for Region C = 4000 - 3000 = 1000
Interquartile Rage for Region D = 2600 - 2250 = 350
Lowest to Highest is given by:
D, A, B, C
(c)
The range depends on only two observations while interquartile range depends on many observations and is therefore more reliable.
Know the answer?
Add Answer to:
for question c, the options for the first two pull down's are - many observations -only two observations and for the th...
Not the answer you're looking for?
Ask your own homework help question.
Our experts will answer your question WITHIN MINUTES for Free.
Similar Homework Help Questions
ADVERTISEMENT
Need Online Homework Help?
Ask
a QuestionGet Answers For Free
Most questions answered within 3 hours.
Most questions answered within 3 hours.
ADVERTISEMENT
ADVERTISEMENT
Active Questions
-
Calculate the pH of each of the following solutions.
0.50 M HBr
3.1×10⁻⁴ M KOH
4.2×10⁻⁵...
asked 1 hour ago -
For the year ended December 31, Depot Max’s cost of merchandise
sold was $85,600. Inventory at the...
asked 1 hour ago -
Week 10 - Professional Memo Assignment
Professional Memo Assignment
Your mission for this week, should you...
asked 1 hour ago -
Write a Python program that stores the data for each
player on the team, and it...
asked 1 hour ago -
In
the last 3 months, mike never knows when he is going to get his
allowance...
asked 1 hour ago -
Is Ca(OH)2 a Bronsted base, Lewis base, or both? Why?
asked 1 hour ago -
1A- Why don’t voters complain about U.S. tariffs on imported
sugar?
Because sugar is only a...
asked 1 hour ago -
Cash Payback Period
Primera Banco is evaluating two capital investment proposals for
a drive-up ATM kiosk,...
asked 1 hour ago -
Create a button in Swift (Xcode) that will create a charge,
create a charge using Stripe's...
asked 1 hour ago -
The reaction rate of CO and NO2 in the reaction
CO(g) + NO2(g) → CO2(g) +...
asked 1 hour ago -
Imagine that a chemist puts 6.40 mol each of
C3H8 and O2 in a 1.00-L container...
asked 2 hours ago -
How much money should be invested today in order to have $8340
at the end of...
asked 2 hours ago
ADVERTISEMENT