
Homework Answers
As per rules and time constraint, only first question is allowed. However, since questions were small, I answered six. Kindly ask other questions separately. Thank you.
Ans) Demand side shifters÷ change in income, change in consumer preference, number of buyers, change in price of related goods etc.
Supply side shifters÷ change in number of sellers, change in technology, change in price of related goods, change in price of input etc.
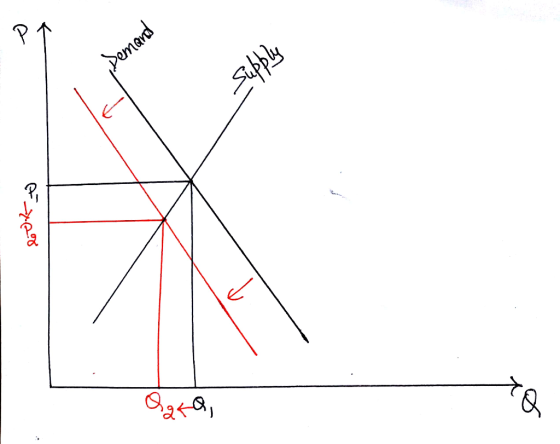
1) When income falls, demand will decline. As a result, demand curve will shift to the left. Both price and quantity will decrease.
2) Due to invetoion of assembly line, production of car became easy. So, supply will increase. Supply curve will shift to the right. Price will decrease and quantity will increase.

3) During expansion, there is increase in employment, income and production activity. When income rises, people prefer buying costly or known or branded products. So, during expansion, demand for off brand toilet paper will decrease. Demand curve will shift to the left.

4) When people decide to be more environment friendly, they will prefer public transport to private or will buy small cars instead of big ones. So, demand for SUV'S will decline and demand curve will shift to the left. Both price and quantity will decrease.

5) When price of an input increases, production becomes costly and the supply decreases. Supply curve will shift to the left. Price will increase and quantity will decrease.

6) With increase in number of boat sellers, supply will increase. Supply curve will shift to the right. Price will decrease and quantity will increase.

Add Answer to:
Supply and Demand Analysis Graphs 1. Show using supply and demand analysis the effect on the yacht market when in...
Using supply and demand diagrams, show the effect of the following events on the market for...
Using supply and demand diagrams, show the effect of the following events on the market for sweatshirts. A hurricane in South Carolina damages the cotton crop. The price of leather jackets falls. All colleges require morning exercise in appropriate attire. New knitting machines are invented. Each original post should include four diagrams with an explanation for each. Respond and engage with at least two of your classmates in your group.
1. Explain each of the following statements using supply-and-demand diagrams. a. “When a cold snap hits...
1. Explain each of the following statements using supply-and-demand diagrams. a. “When a cold snap hits Florida, the price of orange juice rises in supermarkets throughout the country.” b. “When the weather turns warm in New England every summer, the price of hotel rooms in Caribbean resorts plummets.” c. “When a war breaks out in the Middle East, the price of gasoline rises and the price of a used Cadillac falls.” Hints: • Draw both supply and demand curve of...
Supply and demand
According to an article in the New York Times, “Sales of DVD’s in the United States have risen dramatically since the discs first went on the market in 1997, thanks in part to a drop in the price of DVD players.” Draw a demand and supply graph for the DVD market and use it to show the effect on this market of a decline in the price of DVD players. Now, draw a demand and supply graph and use it...
Graphs 1. Show using supply and demand analysis the areas that make up consumer surplus, producer...
 Graphs 1. Show using supply and demand analysis the areas that make up consumer surplus, producer surplus, and total surplus. 2. Show using supply and demand analysis the effect on total surplus if the government provides consumers with an income subsidy. 3. Show using supply and demand analysis the effect on total surplus if there is an increase in a products sales tax.
Supply and Demand
The quantity demanded x of a certain brand of DVD player is 3000/week when the unit price p is $485. For each decrease in unit price of $20 below $485, the quantitydemanded increases by 500 units. The suppliers will not market any DVD players if the unit price is $300 or lower. But at a unit price of $525, they are willing tomake available 2000 units in the market. The supply equation is also known to be linear. Find the...
Using Supply and Demand Diagrams, Show the effect of the following eventson the market for computers,...
 Using Supply and Demand Diagrams, Show the effect of the following
eventson the market for computers, Draw one graph for each part.
All universities mandate income Freshmen to have access to computers. Show in a diagram the direction that demand curve moves what happened to the equilibrium price and quantity? Several components used in the construction of computers become cheaper. Show in another diagram the direction the supply curve moves what happens to the equilibrium price and quantity?
Using Supply and Demand Diagrams, Show the effect of the following
eventson the market for computers, Draw one graph for each part.
All universities mandate income Freshmen to have access to computers. Show in a diagram the direction that demand curve moves what happened to the equilibrium price and quantity? Several components used in the construction of computers become cheaper. Show in another diagram the direction the supply curve moves what happens to the equilibrium price and quantity?
Predict, using demand and supply analysis, the effect on the market equilibrium price (P*). A type...
Predict, using demand and supply analysis, the effect on the market equilibrium price (P*). A type of water beverage (a super-fruit flavor of your own choice) if consumers received credible news that: a) consuming this beverage increases your mental and physical performance and longevity, b) the key ingredient (the super-fruit) in the production of your beverage became more scarce and expensive on its market.
NOSSASSINS Use demand and supply analysis to answer each of the following questions. Assume that the...
 NOSSASSINS Use demand and supply analysis to answer each of the following questions. Assume that the respective market is in equilibrium before the change takes place. Graphically analyze whether there is a movement or a shift in the appropriate curve and then determine the effect on the equilibrium price and quantity. Draw a separate diagram for each question in each market. In the wheat market: A new fertilizer is developed with a lower cost The government imposes a new tax...
Using supply-and-demand diagrams, show the effect of the following events on the market for Pickles. Comment...
 Using supply-and-demand diagrams, show the effect of the following events on the market for Pickles. Comment on what happens to the equilibrium price and quantity 24. (5pts.) Half the population suddenly became allergic to cucumbers 25. (5pts.) The government removes tariffs on cucumber imports
Using supply-and-demand diagrams, show the effect of the following events on the market for Pickles. Comment...
 Using supply-and-demand diagrams, show the effect of the following events on the market for Pickles. Comment on what happens to the equilibrium price and quantity. 22. (5pts.) An early frost cut cucumber production by 25 percent 23. (5pts.) Fast food restaurants were required to put pickles on all hamburgers
 Graphs 1. Show using supply and demand analysis the areas that make up consumer surplus, producer surplus, and total surplus. 2. Show using supply and demand analysis the effect on total surplus if the government provides consumers with an income subsidy. 3. Show using supply and demand analysis the effect on total surplus if there is an increase in a products sales tax.
 Using Supply and Demand Diagrams, Show the effect of the following
eventson the market for computers, Draw one graph for each part.
All universities mandate income Freshmen to have access to computers. Show in a diagram the direction that demand curve moves what happened to the equilibrium price and quantity? Several components used in the construction of computers become cheaper. Show in another diagram the direction the supply curve moves what happens to the equilibrium price and quantity?
Using Supply and Demand Diagrams, Show the effect of the following
eventson the market for computers, Draw one graph for each part.
All universities mandate income Freshmen to have access to computers. Show in a diagram the direction that demand curve moves what happened to the equilibrium price and quantity? Several components used in the construction of computers become cheaper. Show in another diagram the direction the supply curve moves what happens to the equilibrium price and quantity?
 NOSSASSINS Use demand and supply analysis to answer each of the following questions. Assume that the respective market is in equilibrium before the change takes place. Graphically analyze whether there is a movement or a shift in the appropriate curve and then determine the effect on the equilibrium price and quantity. Draw a separate diagram for each question in each market. In the wheat market: A new fertilizer is developed with a lower cost The government imposes a new tax...
 Using supply-and-demand diagrams, show the effect of the following events on the market for Pickles. Comment on what happens to the equilibrium price and quantity 24. (5pts.) Half the population suddenly became allergic to cucumbers 25. (5pts.) The government removes tariffs on cucumber imports
 Using supply-and-demand diagrams, show the effect of the following events on the market for Pickles. Comment on what happens to the equilibrium price and quantity. 22. (5pts.) An early frost cut cucumber production by 25 percent 23. (5pts.) Fast food restaurants were required to put pickles on all hamburgers
Most questions answered within 3 hours.
-
Jamie is doing a survey at her school about whether the students
feel the cafeteria food...
asked 14 minutes ago -
How many liters of 0.669 M KOH will be needed to raise the pH of
0.339...
asked 2 hours ago -
A liquid of density 1270 kg/m 3 flows steadily through a pipe of
varying diameter and...
asked 2 hours ago -
Questions: What should the American executive do?
'A visiting American executive finds that a foreign subsidiary...
asked 2 hours ago -
Activity based costing was introduced as an alternative to
absorption costing.
1. Discuss using illustration the...
asked 2 hours ago -
1. You own shares of Crane DVD Company and are interested in
selling them. With so...
asked 2 hours ago -
How many grams of He are necessary to fill a balloon having a
volume of 4.5E3...
asked 2 hours ago -
The 2 patients, still in the hospital, were interviewed by a
MoH epidemiologist. The interviews revealed...
asked 2 hours ago -
An uncharged capacitor and a resistor are connected in series to
a source of emf. If...
asked 3 hours ago -
If assets are $540,000 and liabilities are $236,000 what is the
amount of owner’s equity?
asked 3 hours ago -
MATH 3421 Maple Assignment 1 Due February 13, 2019 Maple is a
Computer Algebra System that...
asked 3 hours ago -
CODING IN JAVA
Dates are printed in several common formats. Two of the more
common formats...
asked 3 hours ago