find each major functional group peak, identify the fingerprint region.
so far i think that there is a saturated C-H at ~2900cm-1 and a carbonyl group at ~1300 cm-1.
side note: this is my experimental IR graph.
Homework Answers

Add Answer to:
find each major functional group peak, identify the fingerprint region. so far i think that there is a saturated C-H at...
find each major functional group peak, identify the fingerprint region. so far i think that there...
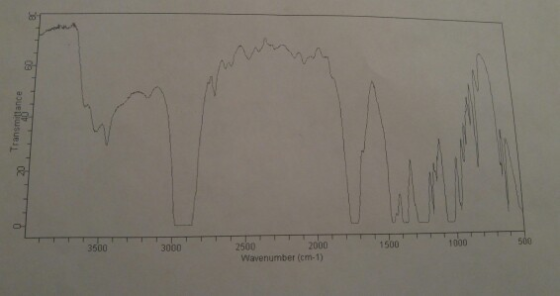
 find each major functional group peak, identify the
fingerprint region.
so far i think that there is a saturated C-H at
~2900cm-1 and a carbonyl group at ~1300 cm-1.
side note: this is my experimental IR graph.
1000 500 3500 2500 3000 Wavenumber (cm-1)
find each major functional group peak, identify the
fingerprint region.
so far i think that there is a saturated C-H at
~2900cm-1 and a carbonyl group at ~1300 cm-1.
side note: this is my experimental IR graph.
1000 500 3500 2500 3000 Wavenumber (cm-1)
1) Identify the functional group (alkane, alkene, ketone, aldehyde, aldehyde, etc) for the compounds providing the...
 1) Identify the functional group (alkane, alkene, ketone, aldehyde, aldehyde, etc) for the compounds providing the IR spectra: % Transmittance 4000 3500 3000 1500 1000 500 2500 2000 Wavenumber(cm) % Transmittance 4000 3500 3000 1500 1000 500 2500 2000 Wavenumber(cm) % Transmittance 1000 3500 3000 1500 1000 500 2500 2000 Wavenumber (cm)
IR spectrum and identify the following functional groups by their IR absorbances on the IR C=O C=...
 IR spectrum and identify the following functional groups by
their IR absorbances on the IR
C=O
C=C (aromatic) or C-O
:絲器器尋尋 2500 2000 Wavenumber cm-1 3500 3000 1500 1000 500
:絲器器尋尋 2500 2000 Wavenumber cm-1 3500 3000 1500 1000 500
IR spectrum and identify the following functional groups by
their IR absorbances on the IR
C=O
C=C (aromatic) or C-O
:絲器器尋尋 2500 2000 Wavenumber cm-1 3500 3000 1500 1000 500
:絲器器尋尋 2500 2000 Wavenumber cm-1 3500 3000 1500 1000 500
IR Worksheet 1. For each spectrum below: 1) Label the major peaks with their approximate frequency....
 IR Worksheet 1. For each spectrum below: 1) Label the major peaks with their approximate frequency. 2) Identify the bond vibration and possible functional group associated with each peak. 3) Match the spectra to one of these possible compounds: NH2 TRANSMITTANCE[%] pobo edo "2060 bo zdoo 160 Tobo 560 WAVENUMBER [cm-1] oot 08 TRANSMITTANCE [%] 09 01 02 4000 3500 3000 2500 2000 WAVENUMBER (cm-1] 1500 1000 500 οοο TRANSMITTANCE (6) οο οο οε 4000 3500 3000 1500 1000 2500...
2. Analysis of IR Data (4 marks) IR peak value Shape/Intensity (cm) Functional Group Molecular Formula...
 2. Analysis of IR Data (4 marks) IR peak value Shape/Intensity (cm) Functional Group Molecular Formula CgH19N IR spectrum 3410 Transmittance 1132 1461 2810 3500 3000 2500 2000 Wavenumber(cm-1) 1500 1000
Based off the IR above, identify the functional groups in the diagnostic region. %Transmittance 3500 3000...
 Based off the IR above, identify the functional groups in the
diagnostic region.
%Transmittance 3500 3000 2965.13 2878.12 2500 Wavenumbers (cm-1) 2000 1728.32 1500 1471.41 1371.07 1176.84 1000 966.66 935.80 3 500 460.03
Based off the IR above, identify the functional groups in the
diagnostic region.
%Transmittance 3500 3000 2965.13 2878.12 2500 Wavenumbers (cm-1) 2000 1728.32 1500 1471.41 1371.07 1176.84 1000 966.66 935.80 3 500 460.03
pling Learning Infrared (IR) spectroscopy is used to identify functional groups within a molecule. Click on...
 pling Learning Infrared (IR) spectroscopy is used to identify functional groups within a molecule. Click on the peak that corresponds to the stretching vibration for the highlighted functional group. Univenity of Michigan 100 50 3500 2500 2000 1500 1000 500 Wavenumber (em
Please help to identifying all major peaks in the functional group region with this IR spectra....
 Please help to identifying all major peaks in the functional group
region with this IR spectra.
This IR is the synthesis of DEET.
74 1942 2321.37cm-1 882.92m 3678 3472 69cm- 2ホ430m-1 1743.05qm- 3 82㎝1 820T-1 944 cm 887,1 45- 914.060 25 086cm-1 4 07cm-1 - 221 3049.89cm-1 2872 98cm-1 1432 84m1102 030m-1736 m-1 2959.97cm-1 1632.68cm-1 793 1381.14cm-1 1088 23cm-1 1000 3000 2500 2000 1500 600 4000 3500 cm-1
Please help to identifying all major peaks in the functional group
region with this IR spectra.
This IR is the synthesis of DEET.
74 1942 2321.37cm-1 882.92m 3678 3472 69cm- 2ホ430m-1 1743.05qm- 3 82㎝1 820T-1 944 cm 887,1 45- 914.060 25 086cm-1 4 07cm-1 - 221 3049.89cm-1 2872 98cm-1 1432 84m1102 030m-1736 m-1 2959.97cm-1 1632.68cm-1 793 1381.14cm-1 1088 23cm-1 1000 3000 2500 2000 1500 600 4000 3500 cm-1
On the provided spectra, do the following -Identify the peaks in the functional region of the spe...
 On the provided spectra, do the following
-Identify the peaks in the functional region of the spectra
- Label the peak characteristics (strong, medium, weak,
broad)
- Identify the unknown molecule (butan-2-ol, cyclohexane,
hexanal, cyclohexanone, tert-butylamine, propionic acid)
98 96 94 92 90 86 84 82 80 78 76 74 72 4000 3500 3000 2500 2000 1500 1000 Wavenumbers (cm-1)
98 96 94 92 90 86 84 82 80 78 76 74 72 4000 3500 3000 2500 2000 1500 1000...
On the provided spectra, do the following
-Identify the peaks in the functional region of the spectra
- Label the peak characteristics (strong, medium, weak,
broad)
- Identify the unknown molecule (butan-2-ol, cyclohexane,
hexanal, cyclohexanone, tert-butylamine, propionic acid)
98 96 94 92 90 86 84 82 80 78 76 74 72 4000 3500 3000 2500 2000 1500 1000 Wavenumbers (cm-1)
98 96 94 92 90 86 84 82 80 78 76 74 72 4000 3500 3000 2500 2000 1500 1000...
Question 2: (R)-Limonene appears to have one peak in the C=C region (1677 cm), but (R)-Limonene's...
 Question 2: (R)-Limonene appears to have one peak in the C=C region (1677 cm), but (R)-Limonene's structure has two alkene double bonds in its structure. Propose an explanation for why a double bond is "missing" from the IR spectrum (Hint: What property determines whether a peak on IR is intense?) 100 1677 cm % Transmittance 1377 cm 1 fingerprint 1436 cm? fingerprint 2919 cm1 4000 3000 1000 2000 1500 Wavenumber (cm)
 find each major functional group peak, identify the
fingerprint region.
so far i think that there is a saturated C-H at
~2900cm-1 and a carbonyl group at ~1300 cm-1.
side note: this is my experimental IR graph.
1000 500 3500 2500 3000 Wavenumber (cm-1)
find each major functional group peak, identify the
fingerprint region.
so far i think that there is a saturated C-H at
~2900cm-1 and a carbonyl group at ~1300 cm-1.
side note: this is my experimental IR graph.
1000 500 3500 2500 3000 Wavenumber (cm-1)
 1) Identify the functional group (alkane, alkene, ketone, aldehyde, aldehyde, etc) for the compounds providing the IR spectra: % Transmittance 4000 3500 3000 1500 1000 500 2500 2000 Wavenumber(cm) % Transmittance 4000 3500 3000 1500 1000 500 2500 2000 Wavenumber(cm) % Transmittance 1000 3500 3000 1500 1000 500 2500 2000 Wavenumber (cm)
 IR spectrum and identify the following functional groups by
their IR absorbances on the IR
C=O
C=C (aromatic) or C-O
:絲器器尋尋 2500 2000 Wavenumber cm-1 3500 3000 1500 1000 500
:絲器器尋尋 2500 2000 Wavenumber cm-1 3500 3000 1500 1000 500
IR spectrum and identify the following functional groups by
their IR absorbances on the IR
C=O
C=C (aromatic) or C-O
:絲器器尋尋 2500 2000 Wavenumber cm-1 3500 3000 1500 1000 500
:絲器器尋尋 2500 2000 Wavenumber cm-1 3500 3000 1500 1000 500
 IR Worksheet 1. For each spectrum below: 1) Label the major peaks with their approximate frequency. 2) Identify the bond vibration and possible functional group associated with each peak. 3) Match the spectra to one of these possible compounds: NH2 TRANSMITTANCE[%] pobo edo "2060 bo zdoo 160 Tobo 560 WAVENUMBER [cm-1] oot 08 TRANSMITTANCE [%] 09 01 02 4000 3500 3000 2500 2000 WAVENUMBER (cm-1] 1500 1000 500 οοο TRANSMITTANCE (6) οο οο οε 4000 3500 3000 1500 1000 2500...
 2. Analysis of IR Data (4 marks) IR peak value Shape/Intensity (cm) Functional Group Molecular Formula CgH19N IR spectrum 3410 Transmittance 1132 1461 2810 3500 3000 2500 2000 Wavenumber(cm-1) 1500 1000
 Based off the IR above, identify the functional groups in the
diagnostic region.
%Transmittance 3500 3000 2965.13 2878.12 2500 Wavenumbers (cm-1) 2000 1728.32 1500 1471.41 1371.07 1176.84 1000 966.66 935.80 3 500 460.03
Based off the IR above, identify the functional groups in the
diagnostic region.
%Transmittance 3500 3000 2965.13 2878.12 2500 Wavenumbers (cm-1) 2000 1728.32 1500 1471.41 1371.07 1176.84 1000 966.66 935.80 3 500 460.03
 pling Learning Infrared (IR) spectroscopy is used to identify functional groups within a molecule. Click on the peak that corresponds to the stretching vibration for the highlighted functional group. Univenity of Michigan 100 50 3500 2500 2000 1500 1000 500 Wavenumber (em
 Please help to identifying all major peaks in the functional group
region with this IR spectra.
This IR is the synthesis of DEET.
74 1942 2321.37cm-1 882.92m 3678 3472 69cm- 2ホ430m-1 1743.05qm- 3 82㎝1 820T-1 944 cm 887,1 45- 914.060 25 086cm-1 4 07cm-1 - 221 3049.89cm-1 2872 98cm-1 1432 84m1102 030m-1736 m-1 2959.97cm-1 1632.68cm-1 793 1381.14cm-1 1088 23cm-1 1000 3000 2500 2000 1500 600 4000 3500 cm-1
Please help to identifying all major peaks in the functional group
region with this IR spectra.
This IR is the synthesis of DEET.
74 1942 2321.37cm-1 882.92m 3678 3472 69cm- 2ホ430m-1 1743.05qm- 3 82㎝1 820T-1 944 cm 887,1 45- 914.060 25 086cm-1 4 07cm-1 - 221 3049.89cm-1 2872 98cm-1 1432 84m1102 030m-1736 m-1 2959.97cm-1 1632.68cm-1 793 1381.14cm-1 1088 23cm-1 1000 3000 2500 2000 1500 600 4000 3500 cm-1
 On the provided spectra, do the following
-Identify the peaks in the functional region of the spectra
- Label the peak characteristics (strong, medium, weak,
broad)
- Identify the unknown molecule (butan-2-ol, cyclohexane,
hexanal, cyclohexanone, tert-butylamine, propionic acid)
98 96 94 92 90 86 84 82 80 78 76 74 72 4000 3500 3000 2500 2000 1500 1000 Wavenumbers (cm-1)
98 96 94 92 90 86 84 82 80 78 76 74 72 4000 3500 3000 2500 2000 1500 1000...
On the provided spectra, do the following
-Identify the peaks in the functional region of the spectra
- Label the peak characteristics (strong, medium, weak,
broad)
- Identify the unknown molecule (butan-2-ol, cyclohexane,
hexanal, cyclohexanone, tert-butylamine, propionic acid)
98 96 94 92 90 86 84 82 80 78 76 74 72 4000 3500 3000 2500 2000 1500 1000 Wavenumbers (cm-1)
98 96 94 92 90 86 84 82 80 78 76 74 72 4000 3500 3000 2500 2000 1500 1000...
 Question 2: (R)-Limonene appears to have one peak in the C=C region (1677 cm), but (R)-Limonene's structure has two alkene double bonds in its structure. Propose an explanation for why a double bond is "missing" from the IR spectrum (Hint: What property determines whether a peak on IR is intense?) 100 1677 cm % Transmittance 1377 cm 1 fingerprint 1436 cm? fingerprint 2919 cm1 4000 3000 1000 2000 1500 Wavenumber (cm)
Most questions answered within 3 hours.
-
Work of 1950 J is done by stirring a perfectly insulated beaker
containing 75 g of...
asked 1 minute from now -
The neighborhood kids set up an outdoor lemonade stand in
Maryland in June. They find that...
asked 7 seconds ago -
9. A company has a beginning inventory of 4,000 units. The
company estimates it will sell...
asked 13 minutes ago -
A patient goes to the doctor's office with symptoms of a urinary
tract infection and provides...
asked 15 minutes ago -
When responding to the essay questions, be sure to cite any
material you obtained from a...
asked 15 minutes ago -
The energy of an electron in a 2.25-eV-deep potential well is
1.50 eV.At what distance into...
asked 17 minutes ago -
Q1:Which three evolutionary innovations are present in land
plants (but not all land plants) that allowed...
asked 20 minutes ago -
Lymphosarcoma is
extremely rare. Risk factors for the disease are largely unknown.
What kind of study...
asked 22 minutes ago -
The solubility of benzoic acid in water is:
0.29g/100mL at 20°C
6.8g/100mL at 100°C
a) What...
asked 24 minutes ago -
Which food law was passed in 1996 and changed how pesticide
residues on food were regulated...
asked 42 minutes ago -
companies either hire outside programmers to
write_____ software or use their own internal developers.
asked 41 minutes ago -
A magnetic dipole m(t) = m_0*cos(ωt) can be
described as current density j(r,t) = −cm(t) ×...
asked 41 minutes ago