

(0) (1 pts) With the data on the next page for Oklahoma City, Ok. fill in the data in Tables 2 and Tables the bin temperatures 62*F and 57 F. Annual Bin Hours for Oklahoma City, OK Table 2 13-16 Temperature 17-20 21-24 e 3 Calaulation of Bin Hours for Each Shif 1abl I II lemperature 00088E8 ae- o0006793" 883 7- O000O000 ODO00 O000 O0
Table B-2 Annual Bin Weather Data for Oklahoma City, Oklahoma, 35°24'N, 97°36W, 1285 ft Elevation Temperature Bin, F Hours of Dry-bulb Occurrence: MCWB Time Group 1-4 Total 21-24 5-8 13-16 17-20 9-12 100/104 95/99 90/94 85/89 80/84 2:77 0:0 0:0 0:0 0:0 0:0 5:74 55:76 116:74 148:72 132:68 138:65 98:58 95:53 2:77 70:76 153:74 145:72 153:68 115:65 118:58 98:54 0:0 29:76 88:74 120:73 168:71 104:76 296:74 407:73 618:71 0:0 0:0 24:74 96:72 0:0 0:0 0:0 2:73 20:72 121:71 229:68 161:64 120:58 0:0 33:73 93:71 221:69 161:65 171:70 186:68 136:62 97:55 776:69 1009:66 747:61 642:54 144:67 117:63 75/79 70/74 65/69 60/64 55/59 50/54 93:56 96:51 116:49 133:45 87:41 99:58 104:53 135:51 108:47 94:45 601:50 684:46 569:42 667:38 621:35 504:30 229:25 171:20 95:15 18:10 81:51 105:50 137:46 100:42 87:53 96:48 98:43 150:39 144:35 107:31 63:25 121:47 103:49 122:42 140:38 105:34 93:30 40:25 31:21 16:15 66:40 96:43 121:39 45/49 40/44 35/39 30/34 25/29 20/24 15/19 67:37 91:38 98:38 76:34 89:34 54:34 40:30 24:24 17:19 1:12 0:0 153:35 140:30 51:26 41:21 37:15 50:30 74:30 24:25 23:19 5:14 0:0 27:26 23:20 17:16 3:9 36:20 19:16 7:10 1:11 7:11 10/14 Source:Reprinted by permission from Bin and Degree Hour Weather Data for Simplified Energy Calculations, ASHRAE, Inc., Atlanta, GA, 1986
Homework Answers

Add Answer to:
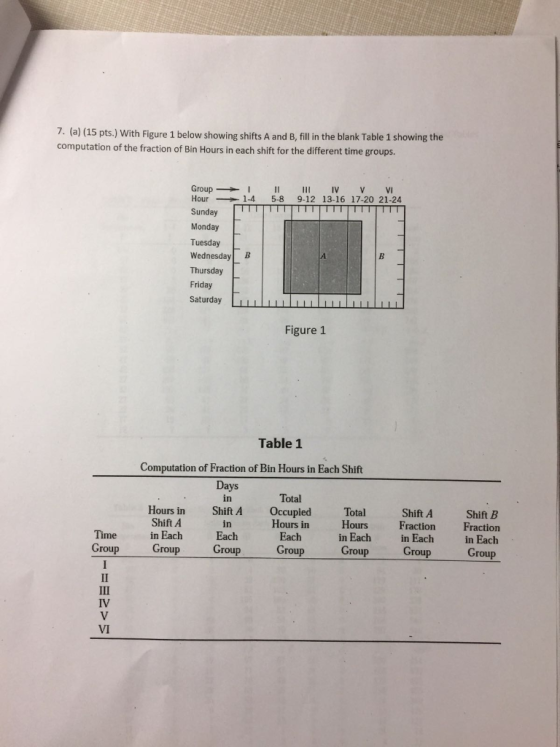
7. (a) (15 pts.) With Figure 1 below showing shifts A and B, fill in the blank Table 1 showing the computation of the...
Consider the below matrixA, which you can copy and paste directly into Matlab.
Problem #1: Consider the below matrix A, which you can copy and paste directly into Matlab. The matrix contains 3 columns. The first column consists of Test #1 marks, the second column is Test # 2 marks, and the third column is final exam marks for a large linear algebra course. Each row represents a particular student.A = [36 45 75 81 59 73 77 73 73 65 72 78 65 55 83 73 57 78 84 31 60 83...
Please show how you did this in excel. :13-19 Every home football game for the past...
 Please show how you did this in excel.
:13-19 Every home football game for the past eight years at Eastern State University has been sold out. The revenues from ticket sales are significant, but the sale of food, beverages, and souvenirs has contrib- uted greatly to the overall profitability of the football program. One particular souvenir is the football pro- gram for each game. The number of programs sold at each game is described by the following probabil- ity distribution:...
Please show how you did this in excel.
:13-19 Every home football game for the past eight years at Eastern State University has been sold out. The revenues from ticket sales are significant, but the sale of food, beverages, and souvenirs has contrib- uted greatly to the overall profitability of the football program. One particular souvenir is the football pro- gram for each game. The number of programs sold at each game is described by the following probabil- ity distribution:...
1. Forecast demand for Year 4. a. Explain what technique you utilized to forecast your demand....
 1. Forecast demand for Year 4.
a. Explain what technique you utilized to forecast your
demand.
b. Explain why you chose this technique over others.
Year 3 Year 1 Year 2 Actual Actual Actual Forecast Forecast Forecast Demand Demand Demand Week 1 52 57 63 55 66 77 Week 2 49 58 68 69 75 65 Week 3 47 50 58 65 80 74 Week 4 60 53 58 55 78 67 57 Week 5 49 57 64 76 77...
1. Forecast demand for Year 4.
a. Explain what technique you utilized to forecast your
demand.
b. Explain why you chose this technique over others.
Year 3 Year 1 Year 2 Actual Actual Actual Forecast Forecast Forecast Demand Demand Demand Week 1 52 57 63 55 66 77 Week 2 49 58 68 69 75 65 Week 3 47 50 58 65 80 74 Week 4 60 53 58 55 78 67 57 Week 5 49 57 64 76 77...
Question 1 15 pts Test scores for a class of 40 students are listed below: 25...
 Question 1 15 pts Test scores for a class of 40 students are listed below: 25 35 43 44 47 48 54 55 56 57 59 62 63 65 66 68 69 69 71 72 72 73 74 76 77 77 78 79 80 81 81 82 83 85 89 92 93 94 97 98 a) The mean of the sample data is b) The median of the sample data is c) The standard deviation of the sample data is...
Use the accompanying data set on the pulse rates (in beats per minute) of males to...
Use the accompanying data set on the pulse rates (in beats per minute) of males to complete parts (a) and (b) below. LOADING... Click the icon to view the pulse rates of males. a. Find the mean and standard deviation, and verify that the pulse rates have a distribution that is roughly normal. The mean of the pulse rates is 71.871.8 beats per minute. (Round to one decimal place as needed.) The standard deviation of the pulse rates is 12.212.2...
Write a python nested for loop that prints out the following pattern 100 99 98 97...
Write a python nested for loop that prints out the following pattern 100 99 98 97 96 95 94 93 92 91 90 89 88 87 86 85 84 83 82 81 80 79 78 77 76 75 74 73 72 71 70 69 68 67 66 65 64 63 62 61 60 59 58 57 56 55 54 53 52 51 50 49 48 47 46 45 44 43 42 41 40 39 38 37 36 35 34 33...
A random sample of 30 male college students was selected, and their heights were measured. The...
A random sample of 30 male college students was selected, and their heights were measured. The heights (in inches) are given below. 67 69 70 69 67 66 73 69 70 67 73 69 68 68 69 73 72 67 68 71 73 71 71 72 70 67 66 74 68 72 (a) Complete the frequency distribution for the data. Make sure to enter your answers for the relative frequency as decimals, rounded to the nearest tenth. Height Frequency Relative...
Find the indicated measure. The test scores of 40 students are listed below. Find P85.
Find the indicated measure. The test scores of 40 students are listed below. Find P85. 30 35 43 44 47 48 54 55 56 57 59 62 63 65 66 68 69 69 71 72 72 73 74 76 77 77 78 79 80 81 81 82 83 85 89 92 93 94 97 98 1) 85 2) 87 3) 89 4) 34
Find the indicated measure. The test scores of 40 students are listed below. Find P85. 30...
 Find the indicated measure. The test scores of 40 students are listed below. Find P85. 30 35 43 44 47 48 54 55 56 57 59 62 63 65 66 68 69 69 71 72 72 73 74 76 77 77 78 79 80 81 81 82 83 85 89 92 93 94 97 98 1) 85 2) 87 3) 89 4) 34
The ExceptionLab class provided: – Creates an array of 100 elements and fills it with random...
 The ExceptionLab class provided: – Creates an array of 100
elements and fills it with random numbers from 1 to 100. – It asks
the user for an index value between 0 and 99. – Prints the element
at that position. – If a number > 99 is entered by the user, the
class will abort with an ArrayIndexOutOfBoundsException • Modify
the ExceptionLab: – Add a try-catch clause which intercepts the
ArrayIndexOutOfBounds and prints the message: Index value cannot be...
The ExceptionLab class provided: – Creates an array of 100
elements and fills it with random numbers from 1 to 100. – It asks
the user for an index value between 0 and 99. – Prints the element
at that position. – If a number > 99 is entered by the user, the
class will abort with an ArrayIndexOutOfBoundsException • Modify
the ExceptionLab: – Add a try-catch clause which intercepts the
ArrayIndexOutOfBounds and prints the message: Index value cannot be...
 Please show how you did this in excel.
:13-19 Every home football game for the past eight years at Eastern State University has been sold out. The revenues from ticket sales are significant, but the sale of food, beverages, and souvenirs has contrib- uted greatly to the overall profitability of the football program. One particular souvenir is the football pro- gram for each game. The number of programs sold at each game is described by the following probabil- ity distribution:...
Please show how you did this in excel.
:13-19 Every home football game for the past eight years at Eastern State University has been sold out. The revenues from ticket sales are significant, but the sale of food, beverages, and souvenirs has contrib- uted greatly to the overall profitability of the football program. One particular souvenir is the football pro- gram for each game. The number of programs sold at each game is described by the following probabil- ity distribution:...
 1. Forecast demand for Year 4.
a. Explain what technique you utilized to forecast your
demand.
b. Explain why you chose this technique over others.
Year 3 Year 1 Year 2 Actual Actual Actual Forecast Forecast Forecast Demand Demand Demand Week 1 52 57 63 55 66 77 Week 2 49 58 68 69 75 65 Week 3 47 50 58 65 80 74 Week 4 60 53 58 55 78 67 57 Week 5 49 57 64 76 77...
1. Forecast demand for Year 4.
a. Explain what technique you utilized to forecast your
demand.
b. Explain why you chose this technique over others.
Year 3 Year 1 Year 2 Actual Actual Actual Forecast Forecast Forecast Demand Demand Demand Week 1 52 57 63 55 66 77 Week 2 49 58 68 69 75 65 Week 3 47 50 58 65 80 74 Week 4 60 53 58 55 78 67 57 Week 5 49 57 64 76 77...
 Question 1 15 pts Test scores for a class of 40 students are listed below: 25 35 43 44 47 48 54 55 56 57 59 62 63 65 66 68 69 69 71 72 72 73 74 76 77 77 78 79 80 81 81 82 83 85 89 92 93 94 97 98 a) The mean of the sample data is b) The median of the sample data is c) The standard deviation of the sample data is...
 Find the indicated measure. The test scores of 40 students are listed below. Find P85. 30 35 43 44 47 48 54 55 56 57 59 62 63 65 66 68 69 69 71 72 72 73 74 76 77 77 78 79 80 81 81 82 83 85 89 92 93 94 97 98 1) 85 2) 87 3) 89 4) 34
 The ExceptionLab class provided: – Creates an array of 100
elements and fills it with random numbers from 1 to 100. – It asks
the user for an index value between 0 and 99. – Prints the element
at that position. – If a number > 99 is entered by the user, the
class will abort with an ArrayIndexOutOfBoundsException • Modify
the ExceptionLab: – Add a try-catch clause which intercepts the
ArrayIndexOutOfBounds and prints the message: Index value cannot be...
The ExceptionLab class provided: – Creates an array of 100
elements and fills it with random numbers from 1 to 100. – It asks
the user for an index value between 0 and 99. – Prints the element
at that position. – If a number > 99 is entered by the user, the
class will abort with an ArrayIndexOutOfBoundsException • Modify
the ExceptionLab: – Add a try-catch clause which intercepts the
ArrayIndexOutOfBounds and prints the message: Index value cannot be...
Most questions answered within 3 hours.
-
Living in a group could bring several disadvantages to an
individual. What are some of the...
asked 3 minutes ago -
Complete and balance the following reactions. In case of no
reaction occurring write NR.
Mix #1:...
asked 8 minutes ago -
If an economy consumes 75% of any increase in income, then an
increase in autonomous investment...
asked 12 minutes ago -
A shotputter throws the shot with an initial speed of 15.8 m/s
at a 38.0 ∘...
asked 27 minutes ago -
Debra and Merina sell electronic equipment and supplies through
their partnership. They wish to expand their...
asked 28 minutes ago -
How does a linear regression allow you to better estimate
trends, costs, and other factors in...
asked 36 minutes ago -
1. (15%) Describe the difference between a pull (Kanban), push
and CONWIP production systems.
asked 32 minutes ago -
QUESTION 5
The total area under the Z distribution curve is equal to:
a.
10
b....
asked 41 minutes ago -
Using Python
The variables x and y refer to numbers. Write a code segment
that prompts...
asked 56 minutes ago -
If
the coefficient of static friction between a box and the floor is
0.35 with what...
asked 58 minutes ago -
A die is designed to punch holes with a radius of 1.08 10-2 m in
a...
asked 1 hour ago -
government can increase import through
a. export subsidies
b. tax breaks
c. increase import tax
d....
asked 1 hour ago