Question


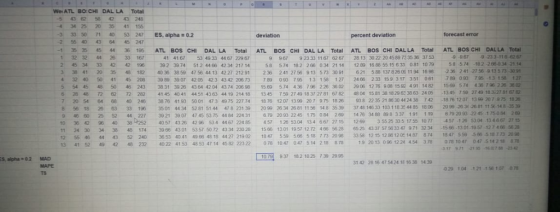
ES, a 0.2 Week ATL BOS CHI Total DAL LA 1 41.00 41.67 44.67 53.00 49,33 229.67 2 40.67 35.67 44.00 44.67 38.00 203.00 3 37.33 33.67 40.67 37.33 37.00 186.00 4 38.33 35.67 32.33 34.33 41.00 181.67 5 38.33 38.33 34,33 39.33 45.00 195.33 6 41.33 42.00 39.33 42.00 46.33 211.00 7 38.00 56.67 44.33 51.00 54.33 244.33 8 34.00 49.00 61.33 60.00 52.67 257.00 34.67 40.00 54.00 64.33 48.33 241.33 10 40.67 44.00 38.33 61.00 39.00 223.00 11 46.00 40.00 49.00 51.67 38.33 225.00 12 35.33 44.00 51.67 43.33 43.33 217.67 13 38.33 39.33 58.00 40.33 46.00 222.00 ES, a 0.4 Week ATL BOS CHI DAL LA Total 1 40 42.40 47.40 45,00 43.60 218.40 2 37.80 36.40 44.60 41.80 41.60 202.20 3 40.00 38.20 47.20 43.20 41.80 210.40 4 41.00 36.40 37.00 42.20 40.80 197.40 5 36.40 36.40 38.40 37.60 40.80 189.60 6 40.20 38.40 39.00 38.80 42.80 199.20 7 39.40 41.60 44.60 46.00 50.60 222.20 8 34.40 45.60 50.80 51.20 50.20 232.20 38.00 41.00 52.00 56.80 47.20 235.00 10 40.80 45.00 47.00 59.00 47.00 238.80 11 37.20 44.40 56.60 57.00 45.40 240.60 12 36.40 40.80 49.00 52.20 40.60 219.00 13 43.40 39.20 45.00 43.00 43.00 217.80 b. Evaluate the forecasts that would have been made over the 13 weeks using the overall (at the end of the 13 weeks) mean absolute deviation, mean absolute percent error, and tracking signal as criteria. (Round your answers to 2 decimal places. Negative values should be indicated by a minus sign.) ATL BOS CHI DAL 10.36 LA Avg of DCs ES, a 0.2 MAD 11.51 9.46 20.44 9.00 MAPE 29.52 22.69 43.91 22.86 19.86 TS 0.26 1.51 -0.38 -1.61 1.67 ES, a 0.4 MAD MAPE TS
Homework Answers
Answer #1
a) Solution:
| Cell | Formula | Copy to |
| K7 | =round(average(D2:D6),2) | K7:P7 |
| K8 | =round(K7+(D7-K7)*0.2,2) | K8:P19 |
| R7 | =ABS(D7-K7) | R7:W19 |
| Y7 | =R7/D7*100 | Y7:AD19 |
| AF7 | =D7-K7 | AF7:AK19 |
| R21 | =AVERAGE(R7:R19) | R24:W24, (Y24:AD24,(in %)) |
| AF20 | =SUM(AF7:AF19) | AF20:AK20 |
| AF23 | =AF20/R21 | AF23:AK23 |
| Cell | Formula | Copy to |
| K7 | =round(average(D2:D6),2) | K7:P7 |
| K8 | =round(K7+(D7-K7)*0.4,2) | K8:P19 |
| R7 | =ABS(D7-K7) | R7:W19 |
| Y7 | =R7/D7*100 | Y7:AD19 |
| AF7 | =D7-K7 | AF7:AK19 |
| R21 | =AVERAGE(R7:R19) | R24:W24, (Y24:AD24,(in %)) |
| AF20 | =SUM(AF7:AF19) | AF20:AK20 |
| AF23 | =AF20/R21 | AF23:AK23 |

b) Solution:

e a AR AC AD A We ATL BOCHI DAL LA Total 58 43 62 43 248 20 3 41 155 forecast error ES, alpha 0.2 deviation percent deviation 55 40 43 64 45 247 ATL BOS CHI DALLA Total 233-11 662 67 182 266-034 21 14 -2.36 241-27 56-913 573 3091 Total 35 35 45 44 1 32 32 44 26 33 167 2 45 34 33 42 42 196 3 38 41 20 35 48 182 4 32 40 50 41 45 36 195 ATL BOS CHI DAL LA BOS CHI DAL LA -1 Total ATL BOS CHI DAL LA Total ATL 28 13 30.22 20 45 89 73 35 36 37 53 12 89 16 88 55 15 6 33 081 10 79 9-967 41 41 67 53 49 33 44 67 229 67 9 967 23 33 11 67 62 67 58-574 574 18 2 266 034 21 14 241 27 56 913 573 30 91 0 93 795 392 3974 51.2 44 66 42 34 217 14 58 621 5 88 137 8 26 0S 11 94 16 98 40 36 38 59 47 56 44 13 4227 212 91 236 208 39 89 39.07 4205 42 3 43 42 206.73 24 00 7.89 158 127 5 4 91 14 82 15 69 5 74 4 36 796 226 30 02 -13 45 750 27 49 18 327 81 67 82 18 76 12.07 13 99 207-975 18 2 20.99 26 3-26 81 11 56-148 -35 39 6 28 48 72 62 72 282 7 20 54 64 68 8 56 18 26 63 33 196 9 46 60 25 52 10 36 42 96 15 81 38 18 29 63 38 63 24 05 48 04 41.45 40 41 44 51 4363 44 19 214 18 759 27 49 18 37 27 81 67 82 13 45 7 42 93 8 22 35 21 80 30 4424 38 38 76 41 93 5001 47 3 49 75 227 74 18 76 1207 13 99 207 975 18 26 40 246 37 48 146 33 103 1 18 35 44 85 18.06 35 01 44 34 52 81 51 44 478 231 39 39 21 39.07 47 45 53 75 44 84 224 31 20 99 26 34 26 81 1156 14 8 35 39 6.79 2093 22 45 175 0 84 260 14 76 34 83 d 44 227 4 57 1 26 53 04-13 46 67 27 15 15 66-13 01-19 57-12 7 466 56 28 18 47 559 5 60 5 18 773 20 9 0 78 10 47 047 514 2 18 878 3.17 971 21 95 16.07 8 -2342 40 65 25 43 37 57 56 33 47 971 32.34 33 58 12 15 12 86 12 05 14 87 8 74 19 20 13 0 96 12 24 454 378 39 06 4301 5357 50 72 4334 230 28 15 66 1301 19 57 12 72 466 56 28 5 59 566 5 18 773 20 98 0.78 10 47 047 5 14 2 18 870 55 46 36 53 40 41 49 66 48 18 44 27 219 02 18 47 44 43 52 240 12 40 22 41 53 48 53 47 14 45 82 223 22 13 48 232 41 52 49 42 10.79 937 182 10 25 739 29 95 ES aipha 0.2 MAD 31 42 28 16 47 54 24 1E 16 38 14.39 MAPE 0 29 104 1 21 156 107 078 TS
We ATL BOCHI DAL LA 5 43 62 58 Total 47 43 248 41 155 35 20 forecast error percent deviation ES, alpha 0.2 deviation -2 55 40 43 64 45 247 -1 35 35 45 44 36 195 132 32 44 26 33 167 2 45 34 33 42 42 196 ATL BOS CHI DALLA Total 8-104 3 4 Total ATL BOS CHI ATL ATL BOS CHI DAL LA DAL LA Total BOS CHI DAL LA Total 30 78 19-10 6 514 325 773 73 0F 32 12 424 474 45 368 38.24 46.04 374 39.36 197 84 25 40 436 2184 104 34 19 106 5141 4 24 13 04 46 201 18 22 82 04 2 08 4 46 20 R 424 7 58 15 1 725 168 1751 3 46 155 16 94 17 65 601 851 11 0E 1.93 45 16 -1541 661 29.11 18.6227 1 06 1 4 32 40 50 41 45 208 5 54 45 48 50 46 243 6 28 48 72 62 72 282 22 66 42 35 02 8 44 344 32 69 13 36 17 7322 16 42 18 58 7 25 8 14 39 25 38 32 32 49 37 54 43 45 191 06 168 17 51 346 155 16 94 601 851 11 08 193 45 16 661 29 11 18.65 27 16 661 36 35 38 99 39 49 38 92 44 07 197 84 17 65 43.41 41 39 42 89 4335 44 84 2159 55 04 13 77 40 43 30 08 37 72 2344 1541 25 66 30.022 12 531 16 42 30 35 48 02 8 12 57 60 4R 42 243 25 65-30 02-32 32 531-164 478 39 23 99 20 39-781 1.15 232 677 361 58 77-16 6-5 31 26 30 458 166 78 1243 843 49 76 24 39 9 46 60 25 52 44 227 10 36 42 96 40 38 252 40 61 3601 45 39 59 81 4285 224 68 11 72 39 96 81 56 15 02 261 102 86 612241 73 13 97 10 47 5.39 23 99 20 39 781 1 15 232 361 58 77 1669 531 26 39 42 77 45 61 37 23 56 69 4331 225.61 677 18 81 14 1 2 84 163 12ns 4 15 56 11 96 604 221 8.00 26 7 3364 385 s0 04 45.21 43 91 211 an 2 604 231 a00 20 7 2.88 20 19 282 555 177 397 1.38 2.33 0 85 922 4 973 20 1 415 47.62 44 33 47 15 222 78 10.5 138 233 0.85 922 41 52 49 42 48 232 42.18 1.18 1 18 105 13 425 2 2 ES, alpha 0.4 11.08 10 14 192 1194 8.83 31.90 MAD 30 27 49 34 27 21 19 s0 15.00 MAPE 31 65 TS 0.38 082 01 034 11 063
D F G ATL BOS CHI DAL Avg of DCs ES, α = 0.2 ΜΑD 3 10.79 9.37 18.2 10.25 7.39 11.2 4 MAPE 31.42 28.16 47.54 24.18 16.38 29.54 TS -0.29 1.04 -1.21 -1.56 1.07 0.19 ES, a 0.4 MAD 11.08 10.14 19.2 11.94 8.83 12.24 MAPE 31.65 30.27 49.34 27 19.58 31.61 TS 0.38 0.82 0.1 0.34 1.1 0.41 10 11 12 LA
Know the answer?
Add Answer to:
Starbucks has a large, global supply chain that must efficiently supply over 17,000 stores. Although the stores mi...
Not the answer you're looking for?
Ask your own homework help question.
Our experts will answer your question WITHIN MINUTES for Free.
Similar Homework Help Questions
Please answer each question and highlight each answer or the table. Starbucks has a Isrge, global supply chain tha...
 Please answer each question and highlight each answer or the table.
Starbucks has a Isrge, global supply chain that must eficienty supply over 17,000 stores. Although the stores might appesr to be very similse, they are actualy very difierent. Depending on the locaion of the store, its size, and the prolile of the oustomers served, Starbucks management oonfigures the store offerings to take maimum advantage of the space available and customer preferenoes. Starbucks' actual distribution system is much more complex,...
Please answer each question and highlight each answer or the table.
Starbucks has a Isrge, global supply chain that must eficienty supply over 17,000 stores. Although the stores might appesr to be very similse, they are actualy very difierent. Depending on the locaion of the store, its size, and the prolile of the oustomers served, Starbucks management oonfigures the store offerings to take maimum advantage of the space available and customer preferenoes. Starbucks' actual distribution system is much more complex,...
ADVERTISEMENT
Need Online Homework Help?
Ask
a QuestionGet Answers For Free
Most questions answered within 3 hours.
Most questions answered within 3 hours.
ADVERTISEMENT
ADVERTISEMENT
Active Questions
-
An economist wants to estimate the mean per capita income (in
thousands of dollars) for a...
asked 18 minutes ago -
What would be the input/output characteristic of a circuit
obtained by putting two of your 2's-complementers...
asked 17 minutes ago -
In Drosophila, the transition from the syncytial blastoderm
stage to the cellular blastoderm stage is a...
asked 45 minutes ago -
Project management question:
Name 3 different types of resources (hint: humans are one
type)
asked 58 minutes ago -
Consider the following reaction: C 2H 2( g) + 2H 2( g) C 2H 6(
g)...
asked 1 hour ago -
Consider a 1.0 L buffer containing 0.092 mol L-1 HCOOH and 0.100
mol L-1 HCOO-. What...
asked 1 hour ago -
Koch Realty has owned a vacant land with a FMV of
$775,000 and an adjusted basis...
asked 1 hour ago -
It is estimated 29% of all adults in United States invest in
stocks and that 85%...
asked 1 hour ago -
What does a 2-sided p value of 0.04 mean? (I am not asking if it
is...
asked 1 hour ago -
A parallel-plate capacitor is made from two aluminum-foil
sheets, each 7.8 cmcm wide and 5.1 mmlong....
asked 1 hour ago -
1. why is toluene a stronger nucleophile than benzene?
2.why is phenol a stronger nucleophile than...
asked 1 hour ago -
4. How can you solve for the density of the liquid from the
slope? Please show...
asked 1 hour ago
ADVERTISEMENT