
Homework Answers

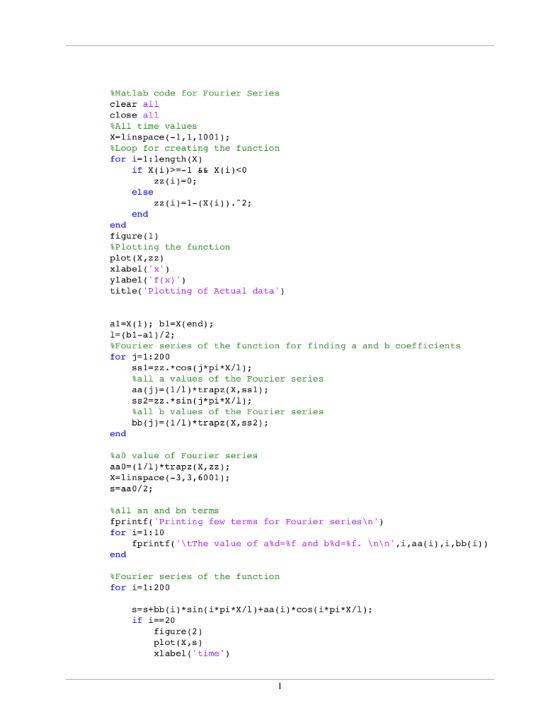


%Matlab code for Fourier Series
clear all
close all
%All time values
X=linspace(-1,1,1001);
%Loop for creating the function
for i=1:length(X)
if X(i)>=-1 && X(i)<0
zz(i)=0;
else
zz(i)=1-(X(i)).^2;
end
end
figure(1)
%Plotting the function
plot(X,zz)
xlabel('x')
ylabel('f(x)')
title('Plotting of Actual data')
a1=X(1); b1=X(end);
l=(b1-a1)/2;
%Fourier series of the function for finding a and b
coefficients
for j=1:200
ss1=zz.*cos(j*pi*X/l);
%all a values of the Fourier series
aa(j)=(1/l)*trapz(X,ss1);
ss2=zz.*sin(j*pi*X/l);
%all b values of the Fourier series
bb(j)=(1/l)*trapz(X,ss2);
end
%a0 value of Fourier series
aa0=(1/l)*trapz(X,zz);
X=linspace(-3,3,6001);
s=aa0/2;
%all an and bn terms
fprintf('Printing few terms for Fourier series\n')
for i=1:10
fprintf('\tThe value of a%d=%f and b%d=%f.
\n\n',i,aa(i),i,bb(i))
end
%Fourier series of the function
for i=1:200
s=s+bb(i)*sin(i*pi*X/l)+aa(i)*cos(i*pi*X/l);
if i==20
figure(2)
plot(X,s)
xlabel('time')
ylabel('f(t)')
title('Fourier series of
given function for 20 terms')
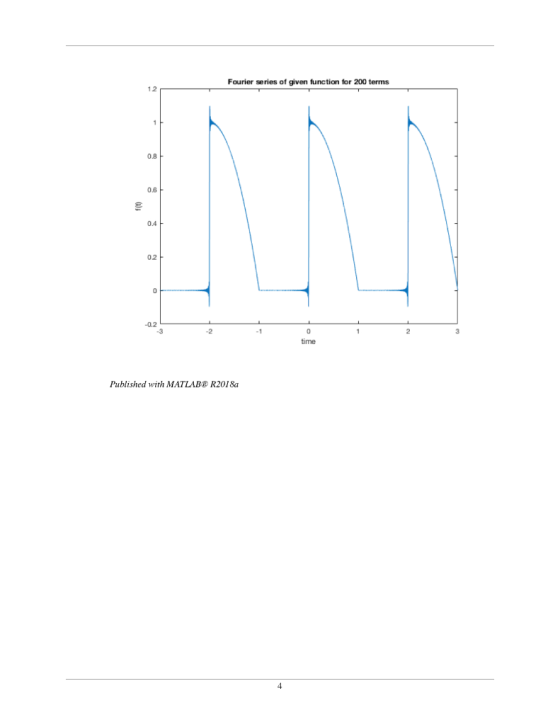
elseif i==200
figure(3)
plot(X,s)
xlabel('time')
ylabel('f(t)')
title('Fourier series of
given function for 200 terms')
end
end
%%%%%%%%%%%%%%%%%% End of Code %%%%%%%%%%%%%%%%%
Add Answer to:
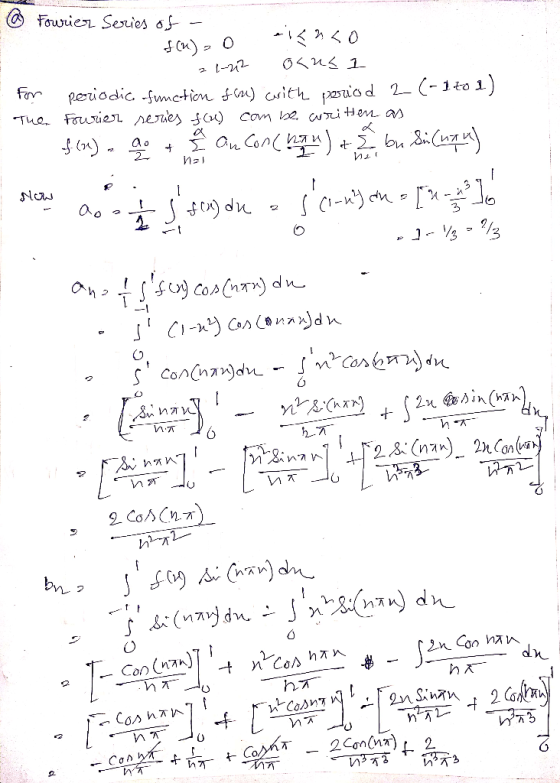
(a) Find the Fourier series for 25 { O if 1 r<O 1-2 if 0<H<1 f(x) defined on the interval -1<rs1. T-2 (b) U...
(a) Find the Fourier series for 25 { O if 1 r<O 1-2 if 0<H<1 f(x) defined on the interval -1<rs1. T-2 (b) U...
 (a) Find the Fourier series for 25 { O if 1 r<O 1-2 if 0<H<1 f(x) defined on the interval -1<rs1. T-2 (b) Using MATLAB, plot the first 20 terms and the first 200 terms of the Fourier series in the interval -3< r<3, In order to do this, the r-interval should be divided into 6001 cqually spaced points by making use of the MATLAB command linspace.
(a) Find the Fourier series for 25 { O if 1 r
(a) Find the Fourier series for 25 { O if 1 r<O 1-2 if 0<H<1 f(x) defined on the interval -1<rs1. T-2 (b) Using MATLAB, plot the first 20 terms and the first 200 terms of the Fourier series in the interval -3< r<3, In order to do this, the r-interval should be divided into 6001 cqually spaced points by making use of the MATLAB command linspace.
(a) Find the Fourier series for 25 { O if 1 r
Using MATLAB (a) Find the Fourier series for 25 { O if 1 r<O 1-2 if 0<H<1 f(x) defined on the interval -1<rs...
 Using MATLAB
(a) Find the Fourier series for 25 { O if 1 r<O 1-2 if 0<H<1 f(x) defined on the interval -1<rs1. T-2 (b) Using MATLAB, plot the first 20 terms and the first 200 terms of the Fourier series in the interval -3< r<3, In order to do this, the r-interval should be divided into 6001 cqually spaced points by making use of the MATLAB command linspace.
(a) Find the Fourier series for 25 { O if 1...
Using MATLAB
(a) Find the Fourier series for 25 { O if 1 r<O 1-2 if 0<H<1 f(x) defined on the interval -1<rs1. T-2 (b) Using MATLAB, plot the first 20 terms and the first 200 terms of the Fourier series in the interval -3< r<3, In order to do this, the r-interval should be divided into 6001 cqually spaced points by making use of the MATLAB command linspace.
(a) Find the Fourier series for 25 { O if 1...
1. (a) Evaluate the Fourier coefficients a, an, ba for the function defined as f)-2 cos() for-π/2...
 1. (a) Evaluate the Fourier coefficients a, an, ba for the function defined as f)-2 cos() for-π/2 s sn2 and zero else over the period of 2T, do NOT use MATLAB or a calculator for integrations. All the steps should be shown. Write a few terms of the Fourier series expansion Plot 2 or 3 cycles of the Fourier series using MATLAB and verify whether the plot matches the given waveform Find Co and Cn and plot the amplitude spectrum...
Find a Fourier series representation in the form x(t)-xp ol + 〉 2 KI k ||...
 Find a Fourier series representation in the form x(t)-xp ol + 〉 2 KI k || cos(kat+ X | k |) of a. に! the impulse train and plot the spectrum of the series through the 5th harmonic. Write out the first five terms of the Fourier series of x(t) b. Now, find a Fourier series representation in the form x(t)=X[0] +Σ2k[k] cos(kay + X[k]) of the following (periodic) square wave に! 0 To To/2 To and plot the spectrum...
3. Consider the periodic function defined by f(x) =sin(r) 0 x<T 0 and f(x) f(x+27) (a) Sketch f(x) on the interval -...
 3. Consider the periodic function defined by f(x) =sin(r) 0 x<T 0 and f(x) f(x+27) (a) Sketch f(x) on the interval -3T < 3T (b) Find the complex Fourier series of f(r) and obtain from it the regular Fourier series.
3. Consider the periodic function defined by f(x) =sin(r) 0 x
3. Consider the periodic function defined by f(x) =sin(r) 0 x<T 0 and f(x) f(x+27) (a) Sketch f(x) on the interval -3T < 3T (b) Find the complex Fourier series of f(r) and obtain from it the regular Fourier series.
3. Consider the periodic function defined by f(x) =sin(r) 0 x
0< x <1 Consider the function f(x) defined on (0,2), f(x)- (a) Fourier Sine series: Use symmetry on the half interval 0 < x <2 to explain why b2 = b4 = … = 0. Then derive a general expres...
 0< x <1 Consider the function f(x) defined on (0,2), f(x)- (a) Fourier Sine series: Use symmetry on the half interval 0 < x <2 to explain why b2 = b4 = … = 0. Then derive a general expression for the non-zero coefficients in the Sine series (bi, b3, bs, ...) and plot the first term in the sine series on top of a graph of f(x)
find the Fourier cosine and sine series for the function f defined on an interval 0<t<L and sketch the graphs of the two extensions of f to which these two series converge: f(t)=1-t, 0<t<1...
find the Fourier cosine and sine series for the function f defined on an interval 0<t<L and sketch the graphs of the two extensions of f to which these two series converge: f(t)=1-t, 0<t<1
2. Find the Fourier series for the periodic function defined by if 0
 2. Find the Fourier series for the periodic function defined by if 0
3. A function f(t) defined on an interval 0 <t<L is given. Find the Fourier cosine...
 3. A function f(t) defined on an interval 0 <t<L is given. Find the Fourier cosine and sine series off. f(t) = 6t(11 – t), 0 <t<n
2. Using the MATLAB "integral" command, numerically determine the Fourier Cosine series of the following function....
 2. Using the MATLAB "integral" command, numerically determine the Fourier Cosine series of the following function. Assume each case has an even extension (b,-0) Last Name N-Z: f= 2xcos (Vx+4), 0<x<3 (Hint: after extension L-3) Have your code plot both the analytical function (as a red line) and the numerical Fourier series (in blue circles -spaced appropriately). Use the Legend command to identify the two items. It is suggested to use a series with 15 terms.
 (a) Find the Fourier series for 25 { O if 1 r<O 1-2 if 0<H<1 f(x) defined on the interval -1<rs1. T-2 (b) Using MATLAB, plot the first 20 terms and the first 200 terms of the Fourier series in the interval -3< r<3, In order to do this, the r-interval should be divided into 6001 cqually spaced points by making use of the MATLAB command linspace.
(a) Find the Fourier series for 25 { O if 1 r
(a) Find the Fourier series for 25 { O if 1 r<O 1-2 if 0<H<1 f(x) defined on the interval -1<rs1. T-2 (b) Using MATLAB, plot the first 20 terms and the first 200 terms of the Fourier series in the interval -3< r<3, In order to do this, the r-interval should be divided into 6001 cqually spaced points by making use of the MATLAB command linspace.
(a) Find the Fourier series for 25 { O if 1 r
 Using MATLAB
(a) Find the Fourier series for 25 { O if 1 r<O 1-2 if 0<H<1 f(x) defined on the interval -1<rs1. T-2 (b) Using MATLAB, plot the first 20 terms and the first 200 terms of the Fourier series in the interval -3< r<3, In order to do this, the r-interval should be divided into 6001 cqually spaced points by making use of the MATLAB command linspace.
(a) Find the Fourier series for 25 { O if 1...
Using MATLAB
(a) Find the Fourier series for 25 { O if 1 r<O 1-2 if 0<H<1 f(x) defined on the interval -1<rs1. T-2 (b) Using MATLAB, plot the first 20 terms and the first 200 terms of the Fourier series in the interval -3< r<3, In order to do this, the r-interval should be divided into 6001 cqually spaced points by making use of the MATLAB command linspace.
(a) Find the Fourier series for 25 { O if 1...
 1. (a) Evaluate the Fourier coefficients a, an, ba for the function defined as f)-2 cos() for-π/2 s sn2 and zero else over the period of 2T, do NOT use MATLAB or a calculator for integrations. All the steps should be shown. Write a few terms of the Fourier series expansion Plot 2 or 3 cycles of the Fourier series using MATLAB and verify whether the plot matches the given waveform Find Co and Cn and plot the amplitude spectrum...
 Find a Fourier series representation in the form x(t)-xp ol + 〉 2 KI k || cos(kat+ X | k |) of a. に! the impulse train and plot the spectrum of the series through the 5th harmonic. Write out the first five terms of the Fourier series of x(t) b. Now, find a Fourier series representation in the form x(t)=X[0] +Σ2k[k] cos(kay + X[k]) of the following (periodic) square wave に! 0 To To/2 To and plot the spectrum...
 3. Consider the periodic function defined by f(x) =sin(r) 0 x<T 0 and f(x) f(x+27) (a) Sketch f(x) on the interval -3T < 3T (b) Find the complex Fourier series of f(r) and obtain from it the regular Fourier series.
3. Consider the periodic function defined by f(x) =sin(r) 0 x
3. Consider the periodic function defined by f(x) =sin(r) 0 x<T 0 and f(x) f(x+27) (a) Sketch f(x) on the interval -3T < 3T (b) Find the complex Fourier series of f(r) and obtain from it the regular Fourier series.
3. Consider the periodic function defined by f(x) =sin(r) 0 x
 0< x <1 Consider the function f(x) defined on (0,2), f(x)- (a) Fourier Sine series: Use symmetry on the half interval 0 < x <2 to explain why b2 = b4 = … = 0. Then derive a general expression for the non-zero coefficients in the Sine series (bi, b3, bs, ...) and plot the first term in the sine series on top of a graph of f(x)
 2. Find the Fourier series for the periodic function defined by if 0
 3. A function f(t) defined on an interval 0 <t<L is given. Find the Fourier cosine and sine series off. f(t) = 6t(11 – t), 0 <t<n
 2. Using the MATLAB "integral" command, numerically determine the Fourier Cosine series of the following function. Assume each case has an even extension (b,-0) Last Name N-Z: f= 2xcos (Vx+4), 0<x<3 (Hint: after extension L-3) Have your code plot both the analytical function (as a red line) and the numerical Fourier series (in blue circles -spaced appropriately). Use the Legend command to identify the two items. It is suggested to use a series with 15 terms.
Most questions answered within 3 hours.
-
Assume memory access is 10 units of time and disk access is
10000 units of time....
asked 12 minutes ago -
1. Are all good samples random?
2. Magazines often report surveys giving statistics such as “63%...
asked 34 minutes ago -
Under all the various types of market structures, firms
must eventually earn some economic profits for...
asked 20 minutes ago -
Consider the following fitness regime for a single locus trait
with two co-dominant alleles: w11 =...
asked 25 minutes ago -
A large cable company reports the following.
80% of its customers subscribe to its cable TV...
asked 40 minutes ago -
Please answer the question in brief.
Discuss the role of ERP in organizations. Are ERP tools...
asked 26 minutes ago -
Discuss the pros and cons of collaborative software such
as SameTime. Does it increase productivity? What...
asked 38 minutes ago -
Buying your in-laws a gift because it’s expected is
due to the ____________ motive of gift-giving....
asked 42 minutes ago -
Calculate the expected value, the variance, and the standard
deviation of the given random variable X....
asked 1 hour ago -
A hospital performs 100 surgeries per week. The probability that
complications after surgery occur is 10%....
asked 1 hour ago -
1 point) Given the significance level α=0.01 find the following:
(a) left-tailed z value z= (b)...
asked 1 hour ago -
Assuming you are the head of the software development unit at
Cyber.Soft, explain and justify why...
asked 49 minutes ago