In the following data, X is the Fahrenheit temperature and Y is the number of times a cricket chirps in 1 minute. Make a...
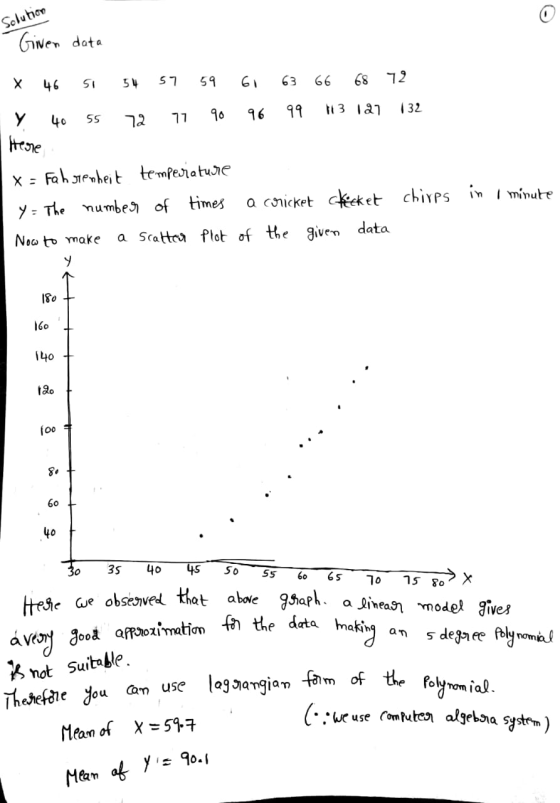
In the following data, X is the Fahrenheit temperature and Y is the number of times a cricket chirps in 1 minute.
Make a scatter plot of the data and discuss the appropriateness of using a 5-degree polynomial that passes through the data points as an empirical model.
Fit a polynomial to the data and plot the results.
|
X |
46 |
51 |
54 |
57 |
59 |
61 |
63 |
66 |
68 |
72 |
|
Y |
40 |
55 |
72 |
77 |
90 |
96 |
99 |
113 |
127 |
132 |
Homework Answers


Add Answer to:
In the following data, X is the Fahrenheit temperature and Y is the number of times a cricket chirps in 1 minute. Make a...
In Problems, construct a scatterplot of the given data. Is there a trend in the data?...
 In Problems, construct a scatterplot of the given data. Is there a trend in the data? Are any of the data points outliers? Construct a divided difference table. Is smoothing with a low-order polynomial appropriate? If so, choose an appropriate polynomial and fit using the least-squares criterion of best fit. Analyze the goodness of fit by examining appropriate indicators and graphing the model, the data points, and the deviations In the following data, X is the Fahrenheit temperature and Y...
Use the accompanying data set on the pulse rates (in beats per minute) of males to...
Use the accompanying data set on the pulse rates (in beats per minute) of males to complete parts (a) and (b) below. LOADING... Click the icon to view the pulse rates of males. a. Find the mean and standard deviation, and verify that the pulse rates have a distribution that is roughly normal. The mean of the pulse rates is 71.871.8 beats per minute. (Round to one decimal place as needed.) The standard deviation of the pulse rates is 12.212.2...
1. 2. The data show the bug chirps per minute at different temperatures. Find the regression...
 1.
2.
The data show the bug chirps per minute at different temperatures. Find the regression equation, letting the first variable be the independent (x) variable. Find the best predicted temperature for a time when a bug is chirping at the rate of 3000 chirps per minute. Use a significance level of 0.05. What is wrong with this predicted value? Chirps in 1 min 1088 835 1239 1075 1212 917 Temperature (°F) 80.9 73.4 88.5 87.3 91.4 77.7 What is...
1.
2.
The data show the bug chirps per minute at different temperatures. Find the regression equation, letting the first variable be the independent (x) variable. Find the best predicted temperature for a time when a bug is chirping at the rate of 3000 chirps per minute. Use a significance level of 0.05. What is wrong with this predicted value? Chirps in 1 min 1088 835 1239 1075 1212 917 Temperature (°F) 80.9 73.4 88.5 87.3 91.4 77.7 What is...
Problem 4: Variables that may affect Grades The data set contains a random sample of STAT 250 Final Exam Scores out of 80 points. For each individual sampled, the time (in hours per week) that the stu...
Problem 4: Variables that may affect Grades The data set contains a random sample of STAT 250 Final Exam Scores out of 80 points. For each individual sampled, the time (in hours per week) that the student spent participating in a GMU club or sport and working for pay outside of GMU was recorded. Values of 0 indicate the students either does not participate in a club or sport or does not work a job for pay. The goal of...
For the following data:, Avg. Height of Parents Male Offsprin
For the following data:, Avg. Height of Parents Male Offspring Height 55 57 58 60 59 63 60 63 62 65 68 68 70 74 70 73 71 75 72 76 73 77 Make scatter diagram of points showing the relationship between Avg Height of Parents (x-axis) and Male Offspring Height (y-axis). A positive slope would suggest a positive correlation of these measures. Give a quantitative genetic...
A. Make a stem-and-leaf display for the following data. Comment about the shape of the distribution....
A. Make a stem-and-leaf display for the following data. Comment about the shape of the distribution. 58 52 68 86 72 66 97 89 84 91 91 92 66 68 87 86 73 61 70 75 72 73 85 84 90 57 77 76 84 93 58 47 B. Construct a frequency distribution using 6 classes with the first lower class limit of 58, draw a Histogram, and what is the shape of distribution? 58, 60, 62, 63, 70, 71, 71, 76,...
Problem 1: Confidence Interval for Percentage of B’s. The data set “STAT 250 Final Exam Scores”...
Problem 1: Confidence Interval for Percentage of B’s. The data set “STAT 250 Final Exam Scores” contains a random sample of 269 STAT 250 students’ final exam scores (maximum of 80) collected over the past two years. Answer the following questions using this data set. a) What proportion of students in our sample earned B’s on the final exam? A letter grade of B is obtained with a score of between 64 and 71 inclusive. Hint: You can do this...
Problem 8.4: Refer to Muscle Mass Problem 1.27. Second-order regression model (8.2) with independent normal error...
Problem 8.4: Refer to Muscle Mass Problem 1.27. Second-order regression model (8.2) with independent normal error terms is expected to be appropriate. A. Fit regression model (8.2). Plot the fitted regression function and the data. Does the quadratic regression function appear to be a good fit here? Find R^2. B. Test whether or not there is regression relation; use α= .05. State the alternatives, decision rule and conclusion. C. Estimate the mean muscle mass for women aged 48...
89 67 84 74 58 51 63 68 84 65 57 76 58 75 72 67...
 89
67
84
74
58
51
63
68
84
65
57
76
58
75
72
67
64
74
95
53
77
86
90
80
70
67
76
62
91
70
63
78
49
61
77
57
83
67
107
67
80
73
94
80
73
74
67
72
68
79
73
121
63
77
70
61
75
66
79
54
76
86
84
72
65
75
63
91
72
64
99
81
58
70
58
58
90
66
64
80...
89
67
84
74
58
51
63
68
84
65
57
76
58
75
72
67
64
74
95
53
77
86
90
80
70
67
76
62
91
70
63
78
49
61
77
57
83
67
107
67
80
73
94
80
73
74
67
72
68
79
73
121
63
77
70
61
75
66
79
54
76
86
84
72
65
75
63
91
72
64
99
81
58
70
58
58
90
66
64
80...
13) The following data represent annual salaries, in thousands of dollars, for 35 employees of a...
 13) The following data represent annual salaries, in thousands of dollars, for 35 employees of a small company. S4 55 55 57 57 59 60 65 65 65 66 68 68 69 69 70 70 70 75 75 75 75 77 82 82 82 88 89 89 91 91 97 98 98 98 (a) (15 pts) Complete the Frequency/Relative Frequency/Cumulative Frequency table below. Fractional values are acceptable. Class Frequency Relative Frequency Cumulative Frequency 54 62 63-71 72-80 81-89 90-98 (2pts)...
 In Problems, construct a scatterplot of the given data. Is there a trend in the data? Are any of the data points outliers? Construct a divided difference table. Is smoothing with a low-order polynomial appropriate? If so, choose an appropriate polynomial and fit using the least-squares criterion of best fit. Analyze the goodness of fit by examining appropriate indicators and graphing the model, the data points, and the deviations In the following data, X is the Fahrenheit temperature and Y...
 1.
2.
The data show the bug chirps per minute at different temperatures. Find the regression equation, letting the first variable be the independent (x) variable. Find the best predicted temperature for a time when a bug is chirping at the rate of 3000 chirps per minute. Use a significance level of 0.05. What is wrong with this predicted value? Chirps in 1 min 1088 835 1239 1075 1212 917 Temperature (°F) 80.9 73.4 88.5 87.3 91.4 77.7 What is...
1.
2.
The data show the bug chirps per minute at different temperatures. Find the regression equation, letting the first variable be the independent (x) variable. Find the best predicted temperature for a time when a bug is chirping at the rate of 3000 chirps per minute. Use a significance level of 0.05. What is wrong with this predicted value? Chirps in 1 min 1088 835 1239 1075 1212 917 Temperature (°F) 80.9 73.4 88.5 87.3 91.4 77.7 What is...
 89
67
84
74
58
51
63
68
84
65
57
76
58
75
72
67
64
74
95
53
77
86
90
80
70
67
76
62
91
70
63
78
49
61
77
57
83
67
107
67
80
73
94
80
73
74
67
72
68
79
73
121
63
77
70
61
75
66
79
54
76
86
84
72
65
75
63
91
72
64
99
81
58
70
58
58
90
66
64
80...
89
67
84
74
58
51
63
68
84
65
57
76
58
75
72
67
64
74
95
53
77
86
90
80
70
67
76
62
91
70
63
78
49
61
77
57
83
67
107
67
80
73
94
80
73
74
67
72
68
79
73
121
63
77
70
61
75
66
79
54
76
86
84
72
65
75
63
91
72
64
99
81
58
70
58
58
90
66
64
80...
 13) The following data represent annual salaries, in thousands of dollars, for 35 employees of a small company. S4 55 55 57 57 59 60 65 65 65 66 68 68 69 69 70 70 70 75 75 75 75 77 82 82 82 88 89 89 91 91 97 98 98 98 (a) (15 pts) Complete the Frequency/Relative Frequency/Cumulative Frequency table below. Fractional values are acceptable. Class Frequency Relative Frequency Cumulative Frequency 54 62 63-71 72-80 81-89 90-98 (2pts)...
Most questions answered within 3 hours.
-
Write a program to solve the Josephus problem, with the following
modification:
Sample Input:
./a.out n...
asked 1 hour ago -
At the start of a CD it is spinning at a rate of 525 rpm
(revolutions...
asked 1 hour ago -
4. Without doing any calculations, predict whether the observed
∆T would increase, decrease or remain the...
asked 3 hours ago -
Based on the range, which of the following sets of scores has
the greatest variability? 3,...
asked 4 hours ago -
Ripples in a pond travel at a velocity of 3 m/s with one peak
passing a...
asked 4 hours ago -
A man stands on the roof of a building of height 13.0 mm and
throws a...
asked 4 hours ago -
The extent to which assets are financed by borrowed funds and
other liabilities is indicated by:...
asked 5 hours ago -
Explain in detail
Germany is the fifth largest economy
explain what goods and services Germany specializes...
asked 5 hours ago -
The density of platinum is 21.45 g/mL. If a cube of platinum
with a mass of...
asked 5 hours ago -
Accounts Receivable
Sales
A/R Posting
Extended Sales Invoice
Packing Slip
Compare invoice to packing slip 2...
asked 5 hours ago -
Michaella, age 23, is a full-time law student and is claimed by
her parents as a...
asked 5 hours ago -
Why are polymers not typically casted into products?
asked 5 hours ago