
Homework Answers
Answer #1
In excel, first, we will make a table of the given data points as -
| 10 | 15.9 |
| 15 | 18.3 |
| 20 | 20.5 |
| 25 | 23.4 |
| 30 | 27.8 |
| 35 | 29 |
| 40 | 31.5 |
| 45 | 33.2 |
| 50 | 34.8 |
Then we will plot a X-y scatter plot, from Insert Menu, and add a trendline.
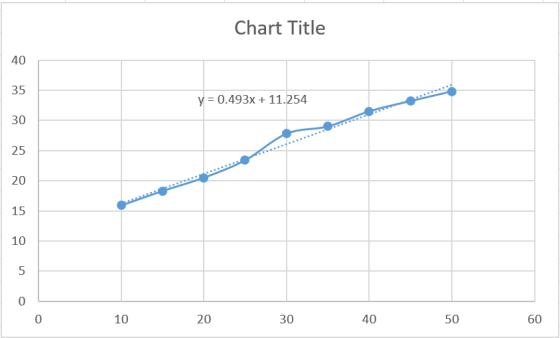
The equation of the trendline is the given model of the system.
Thus the model is given by the equation
y = 0.493x + 11.254
Chart Title 40 35 y 0.493x 11.254 30 20 15 10 5 0 0 10 20 30 40 50 60 25 LC
Know the answer?
Add Answer to:
As the table shows, projections indicate that the percent of adults with diabetes could dramatically increase. Perc...
Not the answer you're looking for?
Ask your own homework help question.
Our experts will answer your question WITHIN MINUTES for Free.
Similar Homework Help Questions
The table shows data from 1975 and projections to 2050 of the number of millions of...
 The table shows data from 1975 and projections to 2050 of the number of millions of people age 15 to 59 in a large country. Complete parts (a) and (b) below. EEClick the icon to view the data table. a function of the number What is the quadratic function that best models this population years after 1970? Let x represent the number of years after 1970 and y represent the number of millians of people in this labor pool. y...
 The table shows data from 1975 and projections to 2050 of the number of millions of people age 15 to 59 in a large country. Complete parts (a) and (b) below. EEClick the icon to view the data table. a function of the number What is the quadratic function that best models this population years after 1970? Let x represent the number of years after 1970 and y represent the number of millians of people in this labor pool. y...
ADVERTISEMENT
Need Online Homework Help?
Ask
a QuestionGet Answers For Free
Most questions answered within 3 hours.
Most questions answered within 3 hours.
ADVERTISEMENT
ADVERTISEMENT
Active Questions
-
1. Are all good samples random?
2. Magazines often report surveys giving statistics such as “63%...
asked 20 minutes ago -
Under all the various types of market structures, firms
must eventually earn some economic profits for...
asked 7 minutes ago -
Consider the following fitness regime for a single locus trait
with two co-dominant alleles: w11 =...
asked 11 minutes ago -
A large cable company reports the following.
80% of its customers subscribe to its cable TV...
asked 27 minutes ago -
Please answer the question in brief.
Discuss the role of ERP in organizations. Are ERP tools...
asked 13 minutes ago -
Discuss the pros and cons of collaborative software such
as SameTime. Does it increase productivity? What...
asked 25 minutes ago -
Buying your in-laws a gift because it’s expected is
due to the ____________ motive of gift-giving....
asked 28 minutes ago -
Calculate the expected value, the variance, and the standard
deviation of the given random variable X....
asked 1 hour ago -
A hospital performs 100 surgeries per week. The probability that
complications after surgery occur is 10%....
asked 1 hour ago -
1 point) Given the significance level α=0.01 find the following:
(a) left-tailed z value z= (b)...
asked 1 hour ago -
Assuming you are the head of the software development unit at
Cyber.Soft, explain and justify why...
asked 36 minutes ago -
Magnesium and nitrogen react in a combination reaction to
produce magnesium nitride. 3 Mg + N2...
asked 44 minutes ago
ADVERTISEMENT