
Homework Answers
Add Answer to:
13. From the graph below, calculate the Ku and V for the uninhibited reaction? Calculate the...
Velocity (mM/min) [S], mM Uninhibited Inhibited 1.75 1.94 1.38 2.17 2.26 1.67 3.00 2.85 2.13 5.50...
Velocity (mM/min) [S], mM Uninhibited Inhibited 1.75 1.94 1.38 2.17 2.26 1.67 3.00 2.85 2.13 5.50 3.55 2.97 10.5 4.39 3.83 (a) Compute for the values of 1/[S] and 1/v for both the uninhibited and inhibited reactions. 1/Velocity (min/mM) 1/[S], mM-1 Uninhibited Inhibited (b) Use MS Excel program to construct the Lineweaver-Burke plots for both reaction systems.Conduct linear regression analysis and compute for the equation of the lines and their respective R2 values. Compute for the Vmax and Km values...
5) (14 marks) The following kinetic data were obtained for an enzyme in the absence of...
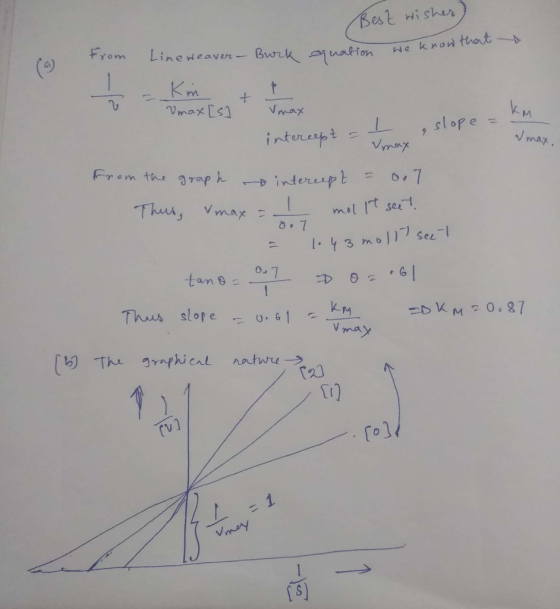
 5) (14 marks) The following kinetic data were obtained for an enzyme in the absence of inhibitor (1), and in the presence of an inhibitor at 5 mM concentration (2). Assume[ET] is the same in each experiment. [S] (MM) (1) v(umol/mL sec) 12 (2) v(umol/mL sec) 4.3 1 8 2 4 20 29 14 21 8 35 12 40 26 a. Using a graphing program (excel or sigmaplot) construct a lineweaver burke plot representing the uninhibited reaction and the inhibited...
show work please! with inhibitor (umoles/min/mg) [S] (mm) v- no inhibitor (umoles/min/mg) V - with inhibitor...
 show work please!
with inhibitor (umoles/min/mg) [S] (mm) v- no inhibitor (umoles/min/mg) V - with inhibitor (umoles 3.0 2.29 x 10³ 1.83 x 10³ 5.0 or ble 3.20 x 10³ Boristeder s obre o 2.56 x 10³ 7.0 3.86 x 10³ USD 3.09 x 10³ 0 9. 4 .36 x 100W 3.49 x 10³ 0 11. 4 .75 x 108 3.80 x 10³ Draw Lineweaver-Burk plots for the enzyme data shown above. When present, I = 0.200 m a) What...
show work please!
with inhibitor (umoles/min/mg) [S] (mm) v- no inhibitor (umoles/min/mg) V - with inhibitor (umoles 3.0 2.29 x 10³ 1.83 x 10³ 5.0 or ble 3.20 x 10³ Boristeder s obre o 2.56 x 10³ 7.0 3.86 x 10³ USD 3.09 x 10³ 0 9. 4 .36 x 100W 3.49 x 10³ 0 11. 4 .75 x 108 3.80 x 10³ Draw Lineweaver-Burk plots for the enzyme data shown above. When present, I = 0.200 m a) What...
CHEM3250 Assignment-Enzyme Inhibition Consider the data below for an enzyme catalyzed reaction. T...
 CHEM3250 Assignment-Enzyme Inhibition Consider the data below for an enzyme catalyzed reaction. The rate of the reaction has been determined with and without an inhibitor. A total concentration of enzyme of 20 uM was used in the experiment. SHOW WORK AND UNITS!!! Without Inhibitor With Inhibitor [substrate] (mM)Rate of formation of te of formation of product product (mM/min) mM/min) 6.67 5.25 0.49 7.04 38.91 1.0 2.2 6.9 41.8 44.0 1.5 3.5 1 a) On the same graph, plot the data...
3. Use the below tables to complete lab calculations on the worksheet on pages 2-6 of...
 3. Use the below tables to complete lab calculations on the worksheet on pages 2-6 of this document. You will submit the worksheet via dropbox on Canvas by you assigned lab time the week of March 30th through April 3rd. A document with sample calculations of different concentrations is provided to you on canvas. Enzyme Kinetics Lab Buffer volume (mL) Enzyme Volume (ml) Substrate Volume (ml) TOTAL VOLUME (mL) 0.04 0.5 1.5 0.04 0.25 1.5 0.04 0.1 1.5 0.04 0.05...
Based on the document below, 1. Describe the hypothesis Chaudhuri et al ids attempting to evaluate;...
 Based on the document below,
1. Describe the hypothesis Chaudhuri et al ids attempting to
evaluate; in other words, what is the goal of this paper? Why is he
writing it?
2. Does the data presented in the paper support the hypothesis
stated in the introduction? Explain.
3.According to Chaudhuri, what is the potential role of thew
alkaline phosphatase in the cleanup of industrial waste.
CHAUDHURI et al: KINETIC BEHAVIOUR OF CALF INTESTINAL ALP WITH PNPP 8.5, 9, 9.5, 10,...
Based on the document below,
1. Describe the hypothesis Chaudhuri et al ids attempting to
evaluate; in other words, what is the goal of this paper? Why is he
writing it?
2. Does the data presented in the paper support the hypothesis
stated in the introduction? Explain.
3.According to Chaudhuri, what is the potential role of thew
alkaline phosphatase in the cleanup of industrial waste.
CHAUDHURI et al: KINETIC BEHAVIOUR OF CALF INTESTINAL ALP WITH PNPP 8.5, 9, 9.5, 10,...
 5) (14 marks) The following kinetic data were obtained for an enzyme in the absence of inhibitor (1), and in the presence of an inhibitor at 5 mM concentration (2). Assume[ET] is the same in each experiment. [S] (MM) (1) v(umol/mL sec) 12 (2) v(umol/mL sec) 4.3 1 8 2 4 20 29 14 21 8 35 12 40 26 a. Using a graphing program (excel or sigmaplot) construct a lineweaver burke plot representing the uninhibited reaction and the inhibited...
 show work please!
with inhibitor (umoles/min/mg) [S] (mm) v- no inhibitor (umoles/min/mg) V - with inhibitor (umoles 3.0 2.29 x 10³ 1.83 x 10³ 5.0 or ble 3.20 x 10³ Boristeder s obre o 2.56 x 10³ 7.0 3.86 x 10³ USD 3.09 x 10³ 0 9. 4 .36 x 100W 3.49 x 10³ 0 11. 4 .75 x 108 3.80 x 10³ Draw Lineweaver-Burk plots for the enzyme data shown above. When present, I = 0.200 m a) What...
show work please!
with inhibitor (umoles/min/mg) [S] (mm) v- no inhibitor (umoles/min/mg) V - with inhibitor (umoles 3.0 2.29 x 10³ 1.83 x 10³ 5.0 or ble 3.20 x 10³ Boristeder s obre o 2.56 x 10³ 7.0 3.86 x 10³ USD 3.09 x 10³ 0 9. 4 .36 x 100W 3.49 x 10³ 0 11. 4 .75 x 108 3.80 x 10³ Draw Lineweaver-Burk plots for the enzyme data shown above. When present, I = 0.200 m a) What...
 CHEM3250 Assignment-Enzyme Inhibition Consider the data below for an enzyme catalyzed reaction. The rate of the reaction has been determined with and without an inhibitor. A total concentration of enzyme of 20 uM was used in the experiment. SHOW WORK AND UNITS!!! Without Inhibitor With Inhibitor [substrate] (mM)Rate of formation of te of formation of product product (mM/min) mM/min) 6.67 5.25 0.49 7.04 38.91 1.0 2.2 6.9 41.8 44.0 1.5 3.5 1 a) On the same graph, plot the data...
 3. Use the below tables to complete lab calculations on the worksheet on pages 2-6 of this document. You will submit the worksheet via dropbox on Canvas by you assigned lab time the week of March 30th through April 3rd. A document with sample calculations of different concentrations is provided to you on canvas. Enzyme Kinetics Lab Buffer volume (mL) Enzyme Volume (ml) Substrate Volume (ml) TOTAL VOLUME (mL) 0.04 0.5 1.5 0.04 0.25 1.5 0.04 0.1 1.5 0.04 0.05...
 Based on the document below,
1. Describe the hypothesis Chaudhuri et al ids attempting to
evaluate; in other words, what is the goal of this paper? Why is he
writing it?
2. Does the data presented in the paper support the hypothesis
stated in the introduction? Explain.
3.According to Chaudhuri, what is the potential role of thew
alkaline phosphatase in the cleanup of industrial waste.
CHAUDHURI et al: KINETIC BEHAVIOUR OF CALF INTESTINAL ALP WITH PNPP 8.5, 9, 9.5, 10,...
Based on the document below,
1. Describe the hypothesis Chaudhuri et al ids attempting to
evaluate; in other words, what is the goal of this paper? Why is he
writing it?
2. Does the data presented in the paper support the hypothesis
stated in the introduction? Explain.
3.According to Chaudhuri, what is the potential role of thew
alkaline phosphatase in the cleanup of industrial waste.
CHAUDHURI et al: KINETIC BEHAVIOUR OF CALF INTESTINAL ALP WITH PNPP 8.5, 9, 9.5, 10,...
Most questions answered within 3 hours.
-
Considering gravitational time dilation, calculate the time that
passes in Earth’s surface while 1 hour passes...
asked 19 minutes ago -
Minitab Problem: Take the Lake Hume June rainfall data and find
use the processes outlined in...
asked 1 hour ago -
X Company is trying to decide whether to continue using old
equipment to make Product A...
asked 1 hour ago -
IN PYTHON ONLY !! Program 2: Re-work
program #5 (WeeklyHours) from the previous assignment such that...
asked 1 hour ago -
The average length of time between arrivals at a turnpike
toll-booth is 26 seconds. What is...
asked 3 hours ago -
(a) A piston at 6.1 atm contains a gas that occupies a volume of
3.5 L....
asked 4 hours ago -
Please answer true or false. Words
cannot be changed or added in to make it true...
asked 4 hours ago -
An empty test tube weighs 15.923 grams. Then,
MgCl2•6H2O is added into the test tube. After...
asked 4 hours ago -
Assume memory access is 10 units of time and disk access is
10000 units of time....
asked 5 hours ago -
1. Are all good samples random?
2. Magazines often report surveys giving statistics such as “63%...
asked 5 hours ago -
Under all the various types of market structures, firms
must eventually earn some economic profits for...
asked 5 hours ago -
Consider the following fitness regime for a single locus trait
with two co-dominant alleles: w11 =...
asked 5 hours ago