

Homework Answers
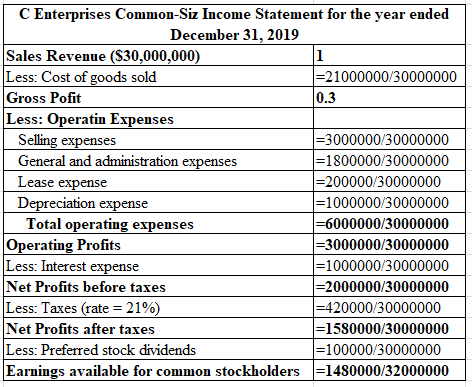
Common-Size Income Statement:

Supporting calculations:
Comparison with 2018 details.
Compare to 2018, the cost of goods sold is increased, due to this, gross margin is decreased from 34.1% to 30%. The percentage of operating expenses is decreased from 23.2% to 20% in 2019. On the other side, the share of taxes are decreased from 2% to 1.40% in 2019. Overall net profit after taxes is decreased from 7.4% to 5.27%. This is also due to decrease in sales revenue from $35,000,000 to $30,000,000 in 2019. Overall, the earnings available to the common stockholders is decreased from 7.3% to 4.63% in 2019.
Sales revenue need to be investigated further for "why is has decreased from $35,000,000 to $30,000,000 because this is the main reason for decrease of profits from 2018 to 2019.
Add Answer to:
133 CHAPTER 3 Financial Statements and Ratio Analysis Common-size statement analysis A common-size income statement for...
133 CHAPTER 3 Financial Statements and Ratio Analysis Common-size statement analysis A common-size income statement for...
 133 CHAPTER 3 Financial Statements and Ratio Analysis Common-size statement analysis A common-size income statement for Enterprises' 2018 operations follows. Using the firm's 2019 income stater Creek ment P3-19 em 3-16, develop the 2019 common-size income statement and compare it with the 2018 statement. Which areas require further analysis and investigation? Creek Enterprises Common-Size Income Statement for the Year Ended December 31, 2018 100.0% 65.9 34.1 % Sales revenue ($35,000,000) Less: Cost of goods sold Gross profits Less: Operating expenses...
P3-19 Common-size statement analysis A common-size income statement for Creek Enterprises 2018 operations follows. Using the...
 P3-19 Common-size statement analysis A common-size income statement for Creek Enterprises 2018 operations follows. Using the firm's 2019 income statement presented in Problem 3-16, develop the 2019 common-size income statement and compare it with the 2018 statement. Which areas require further analysis and investigation? Creek Enterprises Common-Size Income Statement for the Year Ended December 31, 2018 100.0% 65.9 34.1% Sales revenue ($35,000,000) Less: Cost of goods sold Gross profits Less: Operating expenses Selling expense General and administrative expenses Lease expense...
Learning Goals 5 P3–19 Common-size statement analysis A common-size income statement for Creek Enterprises' 2018 operations...
 Learning Goals 5 P3–19 Common-size statement analysis A common-size income statement for Creek Enterprises' 2018 operations follows. Using the firm's 2019 income statement presented in Problem 3–169, develop the 2019 common-size income statement and compare it with the 2018 statement. Which areas require further analysis and investigation? Creek Enterprises Common-Size Income Statement for the Year Ended December 31, 2018 Sales revenue ($35,000,000) 100.0% Less: Cost of goods sold 65.9 Gross profits 34.1% Less: Operating expenses Selling expense 12.7% General and...
Common-size statement analysis A common-size income statement for Creek Enterprises' 2018 operations follows E Using the...
 Common-size statement analysis A common-size income statement for Creek Enterprises' 2018 operations follows E Using the firm's 2019 income statements, develop the 2019 common-size income statement and compare it to the 2018statement. Which areas require further analysis and investigation? Complete the common-size income statement for the year ending December 31, 2019 and compare it to the common-size income statement for the year ending December 2018: (Round to one decimal place.) 100.0 % 66.0 34.0 % Creek Enterprises Common-Size Income Statement...
Construct a common-size income statement. Check figure: NPAT for 2012 should be 4.0% Be sure to...
 Construct a common-size income statement. Check figure: NPAT for 2012 should be 4.0% Be sure to indicate if each account is "better" or "worse" compared to the previous year. P3-19 Common-size statement analysis A common-size income statement for Creek Enterprises' 2011 operations follows. Using the firm's 2012 income statement pre- sented in Problem 3-18, develop the 2012 common-size income statement and com- pare it to the 2011 statement. Which areas require further analysis and investigation? Creek Enterprises Common-Size Income Statement...
. Using the firm's 2019 income statement develop the 2019 common-size income statement and compare it...
 . Using the firm's 2019 income statement develop the 2019 common-size income statement and compare it to the Common-size statement analysis A common-size income statement for Creek Enterprises 2018 operations follows 2018statement. Which areas require further analysis and investigation? Complete the common-size income statement for the year ending December 31, 2019 and compare it to the common-size Income statement for the year ending December 2018: (Round to one decimal place.) Creek Enterprises Common-Size Income Statement for the Years Ended December...
A common-size income statement for Creek Enterprises' 2018 operations follows: Creek Enterprises Income Statement for the...
A common-size income statement for Creek Enterprises' 2018 operations follows: Creek Enterprises Income Statement for the Year Ended December 31, 2018 Sales revenue ($34,966,000) 100.0 % Less: Cost of goods sold 65.6 Gross profits 34.4 % Less: Operating expenses Selling expense 12.7 % General and administrative expenses 6.3 Lease expense 0.5 Depreciation expense ...
PLEASE NOTE: There is a typo in your book regarding the Times-Interest-Earned Ratio. The correct formula...
 PLEASE NOTE: There is a typo in your book regarding the Times-Interest-Earned Ratio. The correct formula is EBIT/Interest Expense. Complete a debt analysis for this company. * Calculate AND interpret the debt ratio, the times-interest-earned ratio, the fixed-payment coverage ratio * Make a credit decision. Based on the loan request and on your analysis, would you approve or deny the loan request? As always, show ALL of your work. P3-18 Debt analysis Springfield Bank is evaluating Creek Enterprises, which has...
I need help on this question. Creek Enterprises Income Statement for the Year Ended December 31,...
 I
need help on this question.
Creek Enterprises Income Statement for the Year Ended December 31, 2018 Sales revenue ($34,963,000) Less Cost of goods sold Creek Enterprises Income Statement for the Year Ended December 31, 2019 Sales revenue Less: Cost of goods sold Gross profits Less: Operating expenses 1000 % $29,980,000 20,995,000 $8,985,000 338 % Less: Operating expenses Seling experse General and administrative expenses 13.3 % $3.041,000 1,774,000 193,000 979,000 Seling expense General and administrative expenses 04 3.6 Lease expense...
I
need help on this question.
Creek Enterprises Income Statement for the Year Ended December 31, 2018 Sales revenue ($34,963,000) Less Cost of goods sold Creek Enterprises Income Statement for the Year Ended December 31, 2019 Sales revenue Less: Cost of goods sold Gross profits Less: Operating expenses 1000 % $29,980,000 20,995,000 $8,985,000 338 % Less: Operating expenses Seling experse General and administrative expenses 13.3 % $3.041,000 1,774,000 193,000 979,000 Seling expense General and administrative expenses 04 3.6 Lease expense...
Chapter 3 – Question 3 The relationship between financial leverage and profitability Pelican Paper, Inc., and...
Chapter 3 – Question 3 The relationship between financial leverage and profitability Pelican Paper, Inc., and Timberland Forest, Inc., are rivals in the manufacture of craft papers. Some financial statement values for each company follow. Item Pelican Paper, Inc. Timberland Forest, Inc. Total assets $10,600,000 $10,600,000 Total equity (all common) 9,900,000 5,100,000 Total debt 700,000 5,500,000 Annual interest 70,000 550,000 Total sales 24,000,000 24,000,000 EBIT 6,000,000 6,000,000 Earnings...
 133 CHAPTER 3 Financial Statements and Ratio Analysis Common-size statement analysis A common-size income statement for Enterprises' 2018 operations follows. Using the firm's 2019 income stater Creek ment P3-19 em 3-16, develop the 2019 common-size income statement and compare it with the 2018 statement. Which areas require further analysis and investigation? Creek Enterprises Common-Size Income Statement for the Year Ended December 31, 2018 100.0% 65.9 34.1 % Sales revenue ($35,000,000) Less: Cost of goods sold Gross profits Less: Operating expenses...
 P3-19 Common-size statement analysis A common-size income statement for Creek Enterprises 2018 operations follows. Using the firm's 2019 income statement presented in Problem 3-16, develop the 2019 common-size income statement and compare it with the 2018 statement. Which areas require further analysis and investigation? Creek Enterprises Common-Size Income Statement for the Year Ended December 31, 2018 100.0% 65.9 34.1% Sales revenue ($35,000,000) Less: Cost of goods sold Gross profits Less: Operating expenses Selling expense General and administrative expenses Lease expense...
 Learning Goals 5 P3–19 Common-size statement analysis A common-size income statement for Creek Enterprises' 2018 operations follows. Using the firm's 2019 income statement presented in Problem 3–169, develop the 2019 common-size income statement and compare it with the 2018 statement. Which areas require further analysis and investigation? Creek Enterprises Common-Size Income Statement for the Year Ended December 31, 2018 Sales revenue ($35,000,000) 100.0% Less: Cost of goods sold 65.9 Gross profits 34.1% Less: Operating expenses Selling expense 12.7% General and...
 Common-size statement analysis A common-size income statement for Creek Enterprises' 2018 operations follows E Using the firm's 2019 income statements, develop the 2019 common-size income statement and compare it to the 2018statement. Which areas require further analysis and investigation? Complete the common-size income statement for the year ending December 31, 2019 and compare it to the common-size income statement for the year ending December 2018: (Round to one decimal place.) 100.0 % 66.0 34.0 % Creek Enterprises Common-Size Income Statement...
 Construct a common-size income statement. Check figure: NPAT for 2012 should be 4.0% Be sure to indicate if each account is "better" or "worse" compared to the previous year. P3-19 Common-size statement analysis A common-size income statement for Creek Enterprises' 2011 operations follows. Using the firm's 2012 income statement pre- sented in Problem 3-18, develop the 2012 common-size income statement and com- pare it to the 2011 statement. Which areas require further analysis and investigation? Creek Enterprises Common-Size Income Statement...
 . Using the firm's 2019 income statement develop the 2019 common-size income statement and compare it to the Common-size statement analysis A common-size income statement for Creek Enterprises 2018 operations follows 2018statement. Which areas require further analysis and investigation? Complete the common-size income statement for the year ending December 31, 2019 and compare it to the common-size Income statement for the year ending December 2018: (Round to one decimal place.) Creek Enterprises Common-Size Income Statement for the Years Ended December...
 PLEASE NOTE: There is a typo in your book regarding the Times-Interest-Earned Ratio. The correct formula is EBIT/Interest Expense. Complete a debt analysis for this company. * Calculate AND interpret the debt ratio, the times-interest-earned ratio, the fixed-payment coverage ratio * Make a credit decision. Based on the loan request and on your analysis, would you approve or deny the loan request? As always, show ALL of your work. P3-18 Debt analysis Springfield Bank is evaluating Creek Enterprises, which has...
 I
need help on this question.
Creek Enterprises Income Statement for the Year Ended December 31, 2018 Sales revenue ($34,963,000) Less Cost of goods sold Creek Enterprises Income Statement for the Year Ended December 31, 2019 Sales revenue Less: Cost of goods sold Gross profits Less: Operating expenses 1000 % $29,980,000 20,995,000 $8,985,000 338 % Less: Operating expenses Seling experse General and administrative expenses 13.3 % $3.041,000 1,774,000 193,000 979,000 Seling expense General and administrative expenses 04 3.6 Lease expense...
I
need help on this question.
Creek Enterprises Income Statement for the Year Ended December 31, 2018 Sales revenue ($34,963,000) Less Cost of goods sold Creek Enterprises Income Statement for the Year Ended December 31, 2019 Sales revenue Less: Cost of goods sold Gross profits Less: Operating expenses 1000 % $29,980,000 20,995,000 $8,985,000 338 % Less: Operating expenses Seling experse General and administrative expenses 13.3 % $3.041,000 1,774,000 193,000 979,000 Seling expense General and administrative expenses 04 3.6 Lease expense...
Most questions answered within 3 hours.
-
An MNE is this kind of industry when competition in one country
is essentially independent of...
asked 53 minutes ago -
. For this set of questions, determine what
proportion of a normal distribution is located betweeneach...
asked 1 hour ago -
A college student is employed as a door-to-door newspaper
salesman. Historical data suggests that the student...
asked 2 hours ago -
MATLAB HW 11 problem using Switch Case and Input commands
Write a script file that calculates...
asked 2 hours ago -
Considering gravitational time dilation, calculate the time that
passes in Earth’s surface while 1 hour passes...
asked 2 hours ago -
Minitab Problem: Take the Lake Hume June rainfall data and find
use the processes outlined in...
asked 3 hours ago -
X Company is trying to decide whether to continue using old
equipment to make Product A...
asked 3 hours ago -
IN PYTHON ONLY !! Program 2: Re-work
program #5 (WeeklyHours) from the previous assignment such that...
asked 4 hours ago -
The average length of time between arrivals at a turnpike
toll-booth is 26 seconds. What is...
asked 5 hours ago -
(a) A piston at 6.1 atm contains a gas that occupies a volume of
3.5 L....
asked 7 hours ago -
Please answer true or false. Words
cannot be changed or added in to make it true...
asked 7 hours ago -
An empty test tube weighs 15.923 grams. Then,
MgCl2•6H2O is added into the test tube. After...
asked 7 hours ago