
Homework Answers
Add Answer to:
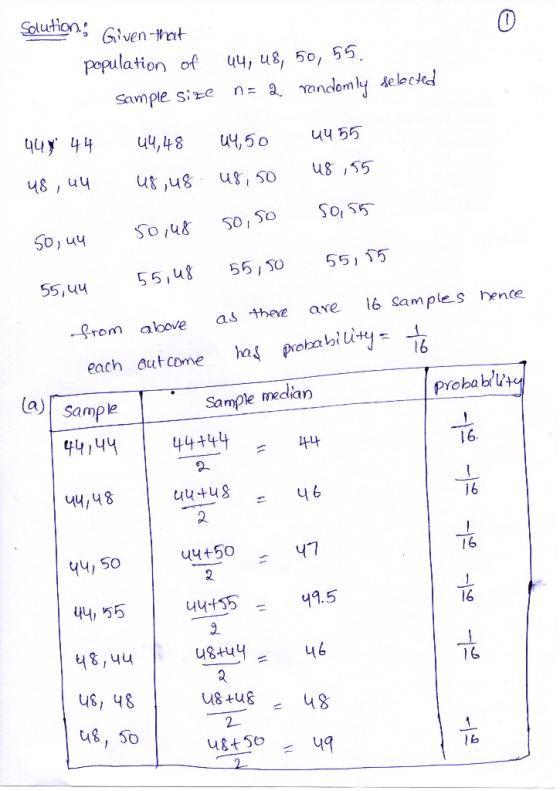
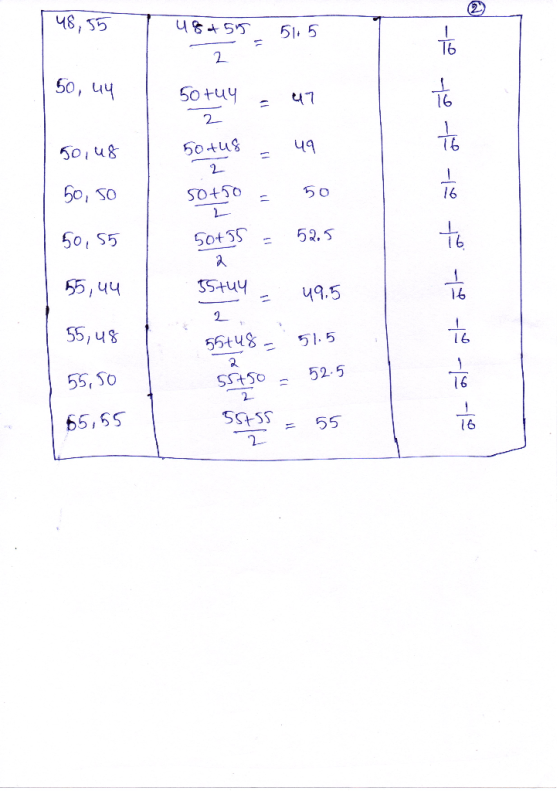
ULUI UTIC TII ULULL.U.IU 0,40.JULUI 6.3.12 Question Help Assume a population of 44, 48, 50, and...
6.3.12 Question Help Assume a population of 46, 50, 52, and 57. Assume that samples of size n = 2 are randomly selected...
 6.3.12 Question Help Assume a population of 46, 50, 52, and 57. Assume that samples of size n = 2 are randomly selected with replacement from the population. Listed below are the sixteen different samples. Complete parts (a) through (c). 46,46 46,50 46.52 46,57 50,46 50,50 50,52 50,57 52,46 52,50 52.52 52,57 57,46 57,50 57,52 57,57 a. Find the median of each of the sixteen samples, then summarize the sampling distribution of the medians in the format of a table...
Three randomly selected households are surveyed. The numbers of people in the households are 44, 55,...
 Three randomly selected households are surveyed. The numbers of
people in the households are
44,
55,
and
99.
Assume that samples of size
nequals=2
are randomly selected with replacement from the population
of
44,
55,
and
99.
Listed below are the nine different samples. Complete parts (a)
through (c).
a) find the variance of each of the nine samples, then summarize
the sampling distribution of the variances in a table representing
the probability distribution of the sample variances.
b) how...
Three randomly selected households are surveyed. The numbers of
people in the households are
44,
55,
and
99.
Assume that samples of size
nequals=2
are randomly selected with replacement from the population
of
44,
55,
and
99.
Listed below are the nine different samples. Complete parts (a)
through (c).
a) find the variance of each of the nine samples, then summarize
the sampling distribution of the variances in a table representing
the probability distribution of the sample variances.
b) how...
Three randomly selected households are surveyed. The numbers of people in the households are 2, 4,...
Three randomly selected households are surveyed. The numbers of people in the households are 2, 4, and 12. Assume that samples of size n=2 are randomly selected with replacement from the population of 2, 4, and 12. Listed below are the nine different samples. Complete parts (a) through (c). 22,22 22,44 22,1212 44,22 44,44 44,1212 1212,22 1212,44 1212,1212 a. Find the median of each of the nine samples, then summarize the sampling distribution of the medians in the format of...
Three randomly selected households are surveyed. The numbers of people in the households are 3, 4,...
 Three randomly selected households are surveyed. The numbers of people in the households are 3, 4, and 11. Assume that samples of size n=2 are randomly selected with replacement from the population of 3, 4, and 11. Listed below are the nine different samples. Complete parts (a) through (c). 3,3 3,4 3,11 4,3 4,4 4,11 11,3 11,4 11,11 a. Find the median of each of the nine samples, then summarize the sampling distribution of the medians in the format of...
Assume a population of 1, 4, and 10. Assume that samples of size n = 2...
 Assume a population of 1, 4, and 10. Assume that samples of size n = 2 are randomly selected with replacement from the population. Listed below are the nine different samples. Complete parts a through d below. 1,1 1,4 1,10 4,1 4,4 4,10 10,1 10,4 10,10 o a. Find the value of the population standard deviation o. (Round to three decimal places as needed.) b. Find the standard deviation of each of the nine samples, then summarize the sampling distribution...
Assume a population of 2, 4, and 9. Assume that samples of size n 2 are...
 Assume a population of 2, 4, and 9. Assume that samples of size n 2 are randomly selected with replacement from the population. Listed below are the nine different samples. Complete parts a through d below 4.9 9,9 2,2 2,4 2,9 4,4 9,2 9.4 a. Find the value of the population standard deviation σ (Round to three decimal places as needed.) b. Find the standard deviation of each of the nine samples, then summarize the sampling distribution of the standard...
Questions 23-30: A normal population has a mean μ = 50 and a standard deviation σ...
Questions 23-30: A normal population has a mean μ = 50 and a standard deviation σ = 8. That is, ?~?(50,8). Circle your final answer for each question below. 23. What is the z-score for an individual with a value of 38? 24. What is the probability that a randomly chosen individual from this population will be greater than 40? 25. What is the probability that a randomly chosen individual from this population will be between 44 and 60? 26....
Question Help 0 44 The data represent the age of world leaders on their day of...
 Question Help 0 44 The data represent the age of world leaders on their day of inauguration. Find the five-number summary, and construct a boxplot for the data. Comment on the shape of the distribution. 63 50 61 56 67 46 55 46 51 44 51 43 52 48 The five-number summary is (Use ascending order.) ],0,0,0. Choose the correct boxplot of the data below. A. B. 1 1 TIT TTTT TTTT 40 50 60 70 40 50 60 70...
The data in the table represent the ages of the winners of an award for the...
 The data in the table represent the ages of the winners of an award for the past five years. Use the data to answer questions (a) through (e). 48 60 44 40 64 (a) Compute the population mean, H. u= 51.2 (b) Compute the mean for all C2 = 10 samples with size n=2. Sample Sample Mean 40.64 52 Sample Sample Mean 48,40 44 48,60 54 48,64 56 40.44 42 46 48,44 40.60 60,64 60,44 64,44 62 52 54 50...
 6.3.12 Question Help Assume a population of 46, 50, 52, and 57. Assume that samples of size n = 2 are randomly selected with replacement from the population. Listed below are the sixteen different samples. Complete parts (a) through (c). 46,46 46,50 46.52 46,57 50,46 50,50 50,52 50,57 52,46 52,50 52.52 52,57 57,46 57,50 57,52 57,57 a. Find the median of each of the sixteen samples, then summarize the sampling distribution of the medians in the format of a table...
 Three randomly selected households are surveyed. The numbers of
people in the households are
44,
55,
and
99.
Assume that samples of size
nequals=2
are randomly selected with replacement from the population
of
44,
55,
and
99.
Listed below are the nine different samples. Complete parts (a)
through (c).
a) find the variance of each of the nine samples, then summarize
the sampling distribution of the variances in a table representing
the probability distribution of the sample variances.
b) how...
Three randomly selected households are surveyed. The numbers of
people in the households are
44,
55,
and
99.
Assume that samples of size
nequals=2
are randomly selected with replacement from the population
of
44,
55,
and
99.
Listed below are the nine different samples. Complete parts (a)
through (c).
a) find the variance of each of the nine samples, then summarize
the sampling distribution of the variances in a table representing
the probability distribution of the sample variances.
b) how...
 Three randomly selected households are surveyed. The numbers of people in the households are 3, 4, and 11. Assume that samples of size n=2 are randomly selected with replacement from the population of 3, 4, and 11. Listed below are the nine different samples. Complete parts (a) through (c). 3,3 3,4 3,11 4,3 4,4 4,11 11,3 11,4 11,11 a. Find the median of each of the nine samples, then summarize the sampling distribution of the medians in the format of...
 Assume a population of 1, 4, and 10. Assume that samples of size n = 2 are randomly selected with replacement from the population. Listed below are the nine different samples. Complete parts a through d below. 1,1 1,4 1,10 4,1 4,4 4,10 10,1 10,4 10,10 o a. Find the value of the population standard deviation o. (Round to three decimal places as needed.) b. Find the standard deviation of each of the nine samples, then summarize the sampling distribution...
 Assume a population of 2, 4, and 9. Assume that samples of size n 2 are randomly selected with replacement from the population. Listed below are the nine different samples. Complete parts a through d below 4.9 9,9 2,2 2,4 2,9 4,4 9,2 9.4 a. Find the value of the population standard deviation σ (Round to three decimal places as needed.) b. Find the standard deviation of each of the nine samples, then summarize the sampling distribution of the standard...
 Question Help 0 44 The data represent the age of world leaders on their day of inauguration. Find the five-number summary, and construct a boxplot for the data. Comment on the shape of the distribution. 63 50 61 56 67 46 55 46 51 44 51 43 52 48 The five-number summary is (Use ascending order.) ],0,0,0. Choose the correct boxplot of the data below. A. B. 1 1 TIT TTTT TTTT 40 50 60 70 40 50 60 70...
 The data in the table represent the ages of the winners of an award for the past five years. Use the data to answer questions (a) through (e). 48 60 44 40 64 (a) Compute the population mean, H. u= 51.2 (b) Compute the mean for all C2 = 10 samples with size n=2. Sample Sample Mean 40.64 52 Sample Sample Mean 48,40 44 48,60 54 48,64 56 40.44 42 46 48,44 40.60 60,64 60,44 64,44 62 52 54 50...
Most questions answered within 3 hours.
-
A university administrator working in student housing wants to
determine if the percentage of students residing...
asked 10 minutes ago -
3). Describe human population growth that has occurred in the
past 400 years. Use terms learned...
asked 7 minutes ago -
A
projectile is blue at a target. The distance from the point of
impact to the...
asked 32 minutes ago -
Given a 32 bit processor, with 2 MB of physical RAM split into 512
frames. What...
asked 22 minutes ago -
What were the main rulings in the Supreme Court cases which are
Morgan v. Virginia (1946)...
asked 21 minutes ago -
write a five paragraph essay on how setting,
specifically culture, influences the actions of
the characters...
asked 13 minutes ago -
JAVA
Provide a simple code sample of Merge sort
asked 24 minutes ago -
Discounting cash flows involves:
A. taking the cash discount offered on a trade merchandise
B. estimating...
asked 31 minutes ago -
A solid wood door 1.00 m wide and 2.00 m high is hinged along
one side...
asked 31 minutes ago -
Raleigh Company manufactures two joint products. At the
split-off point, they have sales values of:
Product...
asked 30 minutes ago -
1. Your grandmother has invested $4000 in a mutual fund each
year on your birthday (she...
asked 33 minutes ago -
HELP WITH SAS
Run the following DATA step to create a SAS data set called
ABC_CORP....
asked 45 minutes ago