
Homework Answers
1 a)
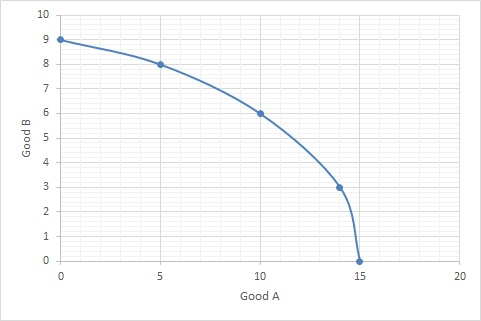
b) Opportunity cost of 7th unit of good B = (10 - 5) / (8 - 6) = 5 /2 = 2.5 units of good A
Opportunity cost of 2nd unit of good B = (15 - 4) / (3 - 0) = 1 /3 = 0.33 units of good A
Add Answer to:
1.a) Graph a PPC by connecting the following points in order: Good A Good B: 0...
Exercise 1 1. Refer to the graph below to answer the following questions. a. b. c....
 Exercise 1 1. Refer to the graph below to answer the following questions. a. b. c. d. e. What is the opportunity cost of a bushel of corn in each country? Which country has an absolute advantage in computer production? Explain. Which country has a comparative advantage in corn production? Explain. If each country specializes, what good will Country B import? Explain. What is the minimum price Country A will accept to export corn to Country B? Explain INTERNATIONAL UNIVERSITY...
In the accompanying graph construct a production possibilities curve for a nation with the following maximum...
 In the accompanying graph construct a production possibilities curve for a nation with the following maximum output combinations. The Production Possibilities Curve Food ideo Games 0 10 10 16 19 1.) Using the point drawing tool, plot the four output combinations from the table above. Properly label each point. 2.) Using the 4-point curved Nne drewing tool, draw a curve connecting these points. Label this curve Carefuly towow the instructions above, and only draw the required abjects The shape of...
Exhibit 33-4 Country 1 Country 2 Good A Good B Good A Good B 250 0...
Exhibit 33-4 Country 1 Country 2 Good A Good B Good A Good B 250 0 75 0 200 10 60 15 150 20 45 30 100 30 30 45 50 40 15 60 0 50 0 75 Refer to Exhibit 33-4. The opportunity cost of one unit of good A is __________ for country 1 and __________ for country 2. A. 20B; 15B B. 0.2B; 1B C. 0.5B; 15B D. 5B; 1B E. 40B; 15B Refer to Exhibit 33-4....
first, move the graph increases/decreases increases/decreases negative/positive/zero The following graph shows the production possibilities curve (PPC)...
 first, move the graph
increases/decreases
increases/decreases
negative/positive/zero
The following graph shows the production possibilities curve (PPC) of an economy that produces food and computers. Suppose that the government eliminates restrictions on foreign private investment. This encourages a large number of multinational corporations to invest in this economy, which increases the amount of capital in the economy 0 0 Adjust the PPC to show the economy's new production possibilities after the increase in capital. 32 PPC 24 O 16 PPC 10...
first, move the graph
increases/decreases
increases/decreases
negative/positive/zero
The following graph shows the production possibilities curve (PPC) of an economy that produces food and computers. Suppose that the government eliminates restrictions on foreign private investment. This encourages a large number of multinational corporations to invest in this economy, which increases the amount of capital in the economy 0 0 Adjust the PPC to show the economy's new production possibilities after the increase in capital. 32 PPC 24 O 16 PPC 10...
Question 5: (5 points) Using the PPC table below, calculate the opportunity cost of producing one...
Question 5: (5 points) Using the PPC table below, calculate the opportunity cost of producing one more of one good in terms of the other (as asked below), between each point (between A & B; B & C; etc.). Don't Include the negative sign or the words 'Capital' or 'Consumer' Combination Consumer Capital A 0 653 B 160 640 C 320 599 D 480 523 E 640 392 F 800 0 1. What is the opportunity cost of one consumer...
c. Between which two consecutive points along the PPC is the opportunity cost of DVDs the highest?
A production possibilities table for DVDs and computers is shown below. Production AlternativesType of ProductionABCDEComputers020406080DVDs807055350 a. Show these data graphically. b. What is the opportunity cost of the first 20 computers? c. Between which two consecutive points along the PPC is the opportunity cost of DVDs the highest?
business economics
 Plot the following combinations of Good X and Good Y on the graph below. Draw the PPC.a. Calculate the cost of increasing production of good X from 0 to 10 units, as measured in the amount of good Y that would need to be sacrificed b. Calculate the cost of increasing production of good X from 10 to 20 units, as measured in the amount of good Y that would need to be sacrificed c. Calculate the cost of increasing production of good X from 20 to...
Table 2: Market Quantity Supplied and Demanded Data for Good X Market Quantity Quantity Prices |...
 Table 2: Market Quantity Supplied and Demanded Data for Good X Market Quantity Quantity Prices | Supplied Demanded P) (O) (od S4.00 4 10 $5.00 6 8 S6.00 $7.00 10 $8.00 12 Exhibit 2.4: Fim X's Points of Production on Iis PPF Points ABCD Capital Goods (K) 30,00 27.00 21.00 12.000.00 Consumption Goods (C) 0.00 10.00 20.00 | 30.00 40.00 4) Refer to Exhibit 2-4. In moving production allocations from points D to B on the Production Possibilities Frontier or...
5 and 6 please Chapter 3&18 Intl Trade, Comparative Advantage Mexico PPC Product ABCDE Avocados Soybeans...
 5 and 6 please
Chapter 3&18 Intl Trade, Comparative Advantage Mexico PPC Product ABCDE Avocados Soybeans 0 20 24 40 60 1510 9 5 0 U.S. PPC Product RSTUV Avocados 0 30 33 60 90 Soybeans 30 20 1910 O Comparative Advantage Questions 1.A What is Mexico's opportunity cost for producing Avocados? 1.B What is Mexico's opportunity cost for producing Soybeans? 2.A What is the U.S.'s opportunity cost for producing Avocados? 2.B What is the U.S's opportunity cost for producing...
5 and 6 please
Chapter 3&18 Intl Trade, Comparative Advantage Mexico PPC Product ABCDE Avocados Soybeans 0 20 24 40 60 1510 9 5 0 U.S. PPC Product RSTUV Avocados 0 30 33 60 90 Soybeans 30 20 1910 O Comparative Advantage Questions 1.A What is Mexico's opportunity cost for producing Avocados? 1.B What is Mexico's opportunity cost for producing Soybeans? 2.A What is the U.S.'s opportunity cost for producing Avocados? 2.B What is the U.S's opportunity cost for producing...
Question II - Graph Traversal and Minimum Spanning Trees [40 Points] Consider the following graph: B...
 Question II - Graph Traversal and Minimum Spanning Trees [40 Points] Consider the following graph: B 10 1 4 1 H 9 4 a) Traverse the graph starting from vertex A, and using the Breadth-First Search algorithm. Show the traversal result and the data structure you are using. [10 Points] b) Traverse the graph starting from vertex A, and using the Depth-First Search (Post-order) algorithm. Show the traversal result and the data structure you are using. [10 Points] c) Apply...
 Exercise 1 1. Refer to the graph below to answer the following questions. a. b. c. d. e. What is the opportunity cost of a bushel of corn in each country? Which country has an absolute advantage in computer production? Explain. Which country has a comparative advantage in corn production? Explain. If each country specializes, what good will Country B import? Explain. What is the minimum price Country A will accept to export corn to Country B? Explain INTERNATIONAL UNIVERSITY...
 In the accompanying graph construct a production possibilities curve for a nation with the following maximum output combinations. The Production Possibilities Curve Food ideo Games 0 10 10 16 19 1.) Using the point drawing tool, plot the four output combinations from the table above. Properly label each point. 2.) Using the 4-point curved Nne drewing tool, draw a curve connecting these points. Label this curve Carefuly towow the instructions above, and only draw the required abjects The shape of...
 first, move the graph
increases/decreases
increases/decreases
negative/positive/zero
The following graph shows the production possibilities curve (PPC) of an economy that produces food and computers. Suppose that the government eliminates restrictions on foreign private investment. This encourages a large number of multinational corporations to invest in this economy, which increases the amount of capital in the economy 0 0 Adjust the PPC to show the economy's new production possibilities after the increase in capital. 32 PPC 24 O 16 PPC 10...
first, move the graph
increases/decreases
increases/decreases
negative/positive/zero
The following graph shows the production possibilities curve (PPC) of an economy that produces food and computers. Suppose that the government eliminates restrictions on foreign private investment. This encourages a large number of multinational corporations to invest in this economy, which increases the amount of capital in the economy 0 0 Adjust the PPC to show the economy's new production possibilities after the increase in capital. 32 PPC 24 O 16 PPC 10...
 Table 2: Market Quantity Supplied and Demanded Data for Good X Market Quantity Quantity Prices | Supplied Demanded P) (O) (od S4.00 4 10 $5.00 6 8 S6.00 $7.00 10 $8.00 12 Exhibit 2.4: Fim X's Points of Production on Iis PPF Points ABCD Capital Goods (K) 30,00 27.00 21.00 12.000.00 Consumption Goods (C) 0.00 10.00 20.00 | 30.00 40.00 4) Refer to Exhibit 2-4. In moving production allocations from points D to B on the Production Possibilities Frontier or...
 5 and 6 please
Chapter 3&18 Intl Trade, Comparative Advantage Mexico PPC Product ABCDE Avocados Soybeans 0 20 24 40 60 1510 9 5 0 U.S. PPC Product RSTUV Avocados 0 30 33 60 90 Soybeans 30 20 1910 O Comparative Advantage Questions 1.A What is Mexico's opportunity cost for producing Avocados? 1.B What is Mexico's opportunity cost for producing Soybeans? 2.A What is the U.S.'s opportunity cost for producing Avocados? 2.B What is the U.S's opportunity cost for producing...
5 and 6 please
Chapter 3&18 Intl Trade, Comparative Advantage Mexico PPC Product ABCDE Avocados Soybeans 0 20 24 40 60 1510 9 5 0 U.S. PPC Product RSTUV Avocados 0 30 33 60 90 Soybeans 30 20 1910 O Comparative Advantage Questions 1.A What is Mexico's opportunity cost for producing Avocados? 1.B What is Mexico's opportunity cost for producing Soybeans? 2.A What is the U.S.'s opportunity cost for producing Avocados? 2.B What is the U.S's opportunity cost for producing...
 Question II - Graph Traversal and Minimum Spanning Trees [40 Points] Consider the following graph: B 10 1 4 1 H 9 4 a) Traverse the graph starting from vertex A, and using the Breadth-First Search algorithm. Show the traversal result and the data structure you are using. [10 Points] b) Traverse the graph starting from vertex A, and using the Depth-First Search (Post-order) algorithm. Show the traversal result and the data structure you are using. [10 Points] c) Apply...
Most questions answered within 3 hours.
-
The inverse demand function for good X is P = 5−0.05Q. The
firm’s cost curve is...
asked 53 seconds from now -
The table to the right lists probabilities for the corresponding
numbers of girls in three births....
asked 45 seconds ago -
The Fresh Connection is really pushing the new line of juice
products. Given that it takes...
asked 4 minutes ago -
An acute decrease in mean arterial pressure (by getting up very
quickly, for instance) will cause...
asked 3 minutes ago -
Is the pH of solutions important when using the Fluoride ISE? If
so, why?
asked 7 minutes ago -
Producer surplus is:
a.
always equal to consumer surplus.
b.
the amount paid to sellers above...
asked 8 minutes ago -
In 2005, Derrek Lee led the National Baseball League with a
0.335 batting average, meaning that...
asked 27 minutes ago -
Write a recursive function moreFactors(a,b,fact) that does the
following:
1. Takes as an input 3 positive...
asked 26 minutes ago -
In order for corporations to behave ethically, they must,
ultimately, give up the profit motive.
...
asked 27 minutes ago -
Blue Spruce Corp. owns equipment that cost $63,400 when
purchased on January 1, 2017. It has...
asked 47 minutes ago -
A lottery exists where balls numbered 1 to 17 are placed in an
urn. To win,...
asked 1 hour ago -
Please explain steps:
An 80 kg swimmer steps off a platform 10 m above the water...
asked 1 hour ago