Type the following table, which has historical world population data, into sheet 2 in rows 1...
Type the following table, which has historical world population data, into sheet 2 in rows 1 and 2.
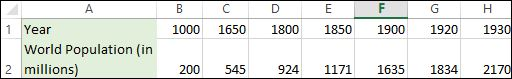
Year 1000 1650 1800 1850 1900 1920 1930 World population, in millions 200 545 924 1171 1635 1834 2170 10.
Graph the above population data using the same steps as in Exercise 1. Add an exponential trendline, being sure to include the equation and R2 value in the chart. 11. In row 3 calculate the values for population predicted for each of the years by your exponential model (as you did in step 9 of exercise 1). You will need to use Excel’s “exp” function for the value of “e”, the base of your exponential model. The complete exponent must be included in parentheses as the input for the exp function. Note: Do not use “^” in the exp function. 12. In cell I1 enter the value 2008. 13. Drag your formula to cell I3. What does your model predict for the world population in 2008? 14. In a complete sentence, explain whether you believe this is realistic, and why. 15. Now let's use goal seek to calculate what year the population was 1 billion (1000 million). 16. Drag the formula from row 3 into cell J3. 17. Highlight cell J3 and click on tools then goal seek. 18. You want Excel to fill in the value in cell J1 so that the formula in J3 results in 1000. So in the pop-up box tell it to “set cell J3 to value 1000 by changing cell J1.” 19. According to your calculations, when was the world population 1 billion? 20. Looking at the actual population values in the table, how accurate do you think your calculation is?
Homework Answers
10)
The scatter plot between Year and World population, is obtained in excel in following steps,
Step 1:Write the data values in excel. The screenshot is shown below,
Step 2: Select the data values then INSERT > Recommended Charts > XY (Scatter) > OK.
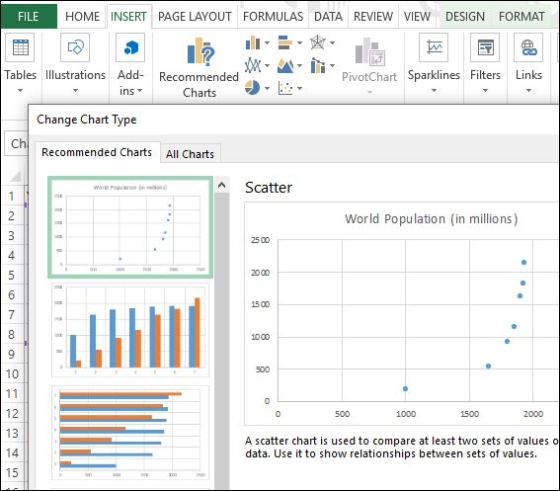
The Chart is obtained. The screenshot is shown below,

The trend line and R square value are added in following steps,
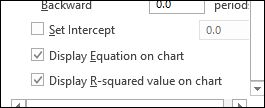
Step 1: Click on add Chart Element > Trendline > More Option > OK. The screenshot is shown below,

Step 2: Select Tending option: Exponential and tick display equation on Chart and display R square value on Chart then OK. The screenshot are shown below,

The plot is shown below,

The trendline equation is,

The R square value is,

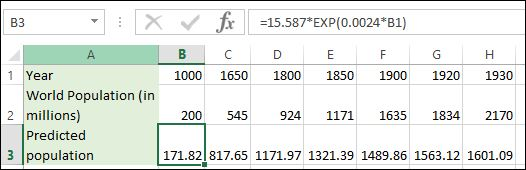
11)
The population for each is predicted using the formula,
12 and 13)

14)
The predicted population for year 2008 is 1930.70 million which is not realistic, since the population is increasing and the actual population of year 1930 had already 2170 millions which is much larger than the prediction of year 2008.
15)
Goal, Y = 1000 million,
16)
Drag the formula from row 3 into cell J3
17)
click on tools then goal seek.

18)
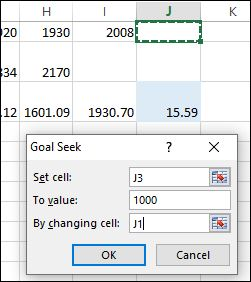

19)
World population was 1000 billion in year 1733.
20)
The actual world population was 1000 billion in year between 1650 and 1800 which is somewhat accurate to our prediction.
(Using calculation
For Y = 1000 million,


Add Answer to:
Type the following table, which has historical world population data, into sheet 2 in rows 1...
Excel Lab 2: Regression and Goal Seek In this lab, you will use Excel to determine...
Excel Lab 2: Regression and Goal Seek In this lab, you will use Excel to determine the equation of the model which best fits a set of ordered pairs obtained from data sets. You will enter data, graph the data, find the equation for the regression model, and then use that equation to make predictions for the dependent variable. You will use the goal seek to make predictions for the independent variable. Then you will consider how accurate your predictions...
All of the following questions are in relation to the following journal article which is available...
 All of the following questions are in relation to the following journal article which is available on Moodle: Parr CL, Magnus MC, Karlstad O, Holvik K, Lund-Blix NA, Jaugen M, et al. Vitamin A and D intake in pregnancy, infant supplementation and asthma development: the Norwegian Mother and Child Cohort. Am J Clin Nutr 2018:107:789-798 QUESTIONS: 1. State one hypothesis the author's proposed in the manuscript. 2. There is previous research that shows that adequate Vitamin A intake is required...
Please read the article bellow and discuss the shift in the company's approach to genetic analysis....
 Please read the article bellow and discuss the shift in the
company's approach to genetic analysis. Please also discuss what
you think about personal genomic companies' approaches to research.
Feel free to compare 23andMe's polices on research with another
company's. Did you think the FDA was right in prohibiting 23andMe
from providing health information?
These are some sample talking points to get you thinking about
the ethics of genetic research in the context of Big Data. You
don't have to...
Please read the article bellow and discuss the shift in the
company's approach to genetic analysis. Please also discuss what
you think about personal genomic companies' approaches to research.
Feel free to compare 23andMe's polices on research with another
company's. Did you think the FDA was right in prohibiting 23andMe
from providing health information?
These are some sample talking points to get you thinking about
the ethics of genetic research in the context of Big Data. You
don't have to...
 All of the following questions are in relation to the following journal article which is available on Moodle: Parr CL, Magnus MC, Karlstad O, Holvik K, Lund-Blix NA, Jaugen M, et al. Vitamin A and D intake in pregnancy, infant supplementation and asthma development: the Norwegian Mother and Child Cohort. Am J Clin Nutr 2018:107:789-798 QUESTIONS: 1. State one hypothesis the author's proposed in the manuscript. 2. There is previous research that shows that adequate Vitamin A intake is required...
 Please read the article bellow and discuss the shift in the
company's approach to genetic analysis. Please also discuss what
you think about personal genomic companies' approaches to research.
Feel free to compare 23andMe's polices on research with another
company's. Did you think the FDA was right in prohibiting 23andMe
from providing health information?
These are some sample talking points to get you thinking about
the ethics of genetic research in the context of Big Data. You
don't have to...
Please read the article bellow and discuss the shift in the
company's approach to genetic analysis. Please also discuss what
you think about personal genomic companies' approaches to research.
Feel free to compare 23andMe's polices on research with another
company's. Did you think the FDA was right in prohibiting 23andMe
from providing health information?
These are some sample talking points to get you thinking about
the ethics of genetic research in the context of Big Data. You
don't have to...
Most questions answered within 3 hours.
-
Do not neglect the old for the new. The existing business must
not lose priority simply...
asked 56 minutes ago -
Kylie is a single mom with two dependent children,
Tanner, age 7 and Olivia, age 11....
asked 2 hours ago -
Phosphorous + bromine = phosphorous tribromide. If 35.0 g of
bromine are reacted and 27.9 grams...
asked 3 hours ago -
Derive the long wavelength limit of the Planck energy density
distribution
asked 3 hours ago -
Calculate the pH of each of the following solutions.
0.50 M HBr
3.1×10⁻⁴ M KOH
4.2×10⁻⁵...
asked 7 hours ago -
For the year ended December 31, Depot Max’s cost of merchandise
sold was $85,600. Inventory at the...
asked 7 hours ago -
Week 10 - Professional Memo Assignment
Professional Memo Assignment
Your mission for this week, should you...
asked 7 hours ago -
Write a Python program that stores the data for each
player on the team, and it...
asked 7 hours ago -
In
the last 3 months, mike never knows when he is going to get his
allowance...
asked 7 hours ago -
Is Ca(OH)2 a Bronsted base, Lewis base, or both? Why?
asked 7 hours ago -
1A- Why don’t voters complain about U.S. tariffs on imported
sugar?
Because sugar is only a...
asked 7 hours ago -
Cash Payback Period
Primera Banco is evaluating two capital investment proposals for
a drive-up ATM kiosk,...
asked 7 hours ago