Construct the indicated confidence interval for the population mean μ using the t-distribution
X6.2.9-T
Construct the indicated confidence interval for the population mean μ using the t-distribution. Assume the population is normally distributed
c = 0.90, x̅ = 12.9, s = 4.0, n = 9
The 90% confidence interval using a t-distribution is
6.2.17-T
In a random sample of 26 people, the mean commute time to work was 34.8 minutes and the standard deviation was 7.2 minutes. Assume the population is normally distributed and use a t-distribution to construct a 98% confidence interval for the population mean μ What is the margin of error of μ? Interpret the results.
The confidence interval for the population mean μ is
Homework Answers
1)
X bar = 12.9
Std Dev (s) = 4
n = 9
Degrees of Freedom(df) = n -1 = 8
Alpha = 0.1
T Critical using the alpha = 0.1 and df = 1.859
Confidence Interval using t distribution is calculated using the below formulae:
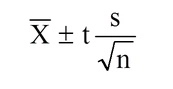
= 12.9 +/- 1.859 * (4/3) = {10.42,15.38}
The 90% confidence interval using a t distribution is (10.4,15.4)
2)
X bar = 34.8
Std Dev (s) = 7.2
n = 26
Degrees of Freedom(df) = n -1 = 25
Alpha = 0.02
T Critical using the alpha = 0.02 and df = 2.478
Confidence Interval using t distribution is calculated using the below formulae:

= 34.8 +/- 2.478 * (7.2/sqrt(26)) = {31.3,38.3}
The 98% confidence interval using a t distribution is {31.3,38.3}
Margin of Error = t*s/n1/2 = 3.5
Add Answer to:
Construct the indicated confidence interval for the population mean μ using the t-distribution
Construct the indicated confidence interval for the population mean mu μ using the t-distribution. Assume the...
Construct the indicated confidence interval for the population mean mu μ using the t-distribution. Assume the population is normally distributed. c equals = 0.90 0.90, x overbar x equals = 14.1 14.1, s equals = 4.0 4.0, n equals = 6 6 The 90 90% confidence interval using a t-distribution is left parenthesis nothing comma nothing right parenthesis . , .
Answers only is okay! Construct the indicated confidence interval for the population mean μ using the...
Answers only is okay! Construct the indicated confidence interval for the population mean μ using the t-distribution. Assume the population is normally distributed. c=0.99, x=13.1, s=3.0, n= 6 Construct the indicated confidence interval for the population mean μ using the t-distribution. Assume the population is normally distributed. c=0.95, x=14.5, s=0.55, n= 15 Use the given confidence interval to find the margin of error and the sample mean. (12.7,19.9The sample mean is In a random sample of 18 people, the mean...
Construct the indicated confidence interval for the population mean μ using the t-distribution. Assume the population...
 Construct the indicated confidence interval for the population
mean μ using the t-distribution. Assume the population is normally
distributed.
Construct the indicated confidence interval for the population mean μ using the t-distribution. Assume the population is normally distributed c-0.98, x-12.4, s 0.91, n 13 Round to one decimal place as needed.)
Construct the indicated confidence interval for the population
mean μ using the t-distribution. Assume the population is normally
distributed.
Construct the indicated confidence interval for the population mean μ using the t-distribution. Assume the population is normally distributed c-0.98, x-12.4, s 0.91, n 13 Round to one decimal place as needed.)
Construct the indicated confidence interval for the population mean mu using the t-distribution.
Construct the indicated confidence interval for the population mean mu using the t-distribution. Assume the population is normally distributed. c = 0.99, x̅ =12.1, s = 4.0, n = 7
Construct the indicated confidence interval for the population mean μ using the t-distribution. Assume the population...
Construct the indicated confidence interval for the population mean μ using the t-distribution. Assume the population is normally distributed. c =0.99, x overbar =14.6, s=4.0, n=8
A) Construct the indicated confidence interval for the population mean μ using the t-distribution. Assume the...
A) Construct the indicated confidence interval for the population mean μ using the t-distribution. Assume the population is normally distributed. c = 0.99, x equals = 12.4, s = 4.0, n =7 ( ? , ? ) (Round to one decimal place as needed.) B) The state test scores for 12 randomly selected high school seniors are shown on the right. Complete parts (a) through (c) below. Assume the population is normally distributed. 1424 1224 980 697 730 834 723...
Construct the indicated confidence interval for the population mean μ using the t distribution. Assume the...
 Construct the indicated confidence interval for the population mean μ using the t distribution. Assume the population is normally distributed c:0.98, x=13.1, s:0 82, n; 13 Round to one decimal place as needed)
Construct the indicated confidence interval for the population mean y using the t-distribution. Assume the population...
 Construct the indicated confidence interval for the population mean y using the t-distribution. Assume the population is normally distributed c=0.90, x= 14.6, s = 2.0, n= 10 The 90% confidence interval using a t-distribution is (Round to one decimal place as needed.)
Construct the indicated confidence interval for the population mean μ using a t-distribution. c =0.90, x...
Construct the indicated confidence interval for the population mean μ using a t-distribution. c =0.90, x =113, s=10, n =11
Construct the indicated confidence interval for the population mean mu using the t-distribution. Assume the population...
Construct the indicated confidence interval for the population mean mu using the t-distribution. Assume the population is normally distributed. C= 0.99 , X= 14.7 S = 4.0 , N= 9 ; C= 0.98 , X= 12.6 S = .89 , N= 19
 Construct the indicated confidence interval for the population
mean μ using the t-distribution. Assume the population is normally
distributed.
Construct the indicated confidence interval for the population mean μ using the t-distribution. Assume the population is normally distributed c-0.98, x-12.4, s 0.91, n 13 Round to one decimal place as needed.)
Construct the indicated confidence interval for the population
mean μ using the t-distribution. Assume the population is normally
distributed.
Construct the indicated confidence interval for the population mean μ using the t-distribution. Assume the population is normally distributed c-0.98, x-12.4, s 0.91, n 13 Round to one decimal place as needed.)
 Construct the indicated confidence interval for the population mean μ using the t distribution. Assume the population is normally distributed c:0.98, x=13.1, s:0 82, n; 13 Round to one decimal place as needed)
 Construct the indicated confidence interval for the population mean y using the t-distribution. Assume the population is normally distributed c=0.90, x= 14.6, s = 2.0, n= 10 The 90% confidence interval using a t-distribution is (Round to one decimal place as needed.)
Most questions answered within 3 hours.
-
2. Boris recently synthesized an explosive compound he named
Badenoughium. The molecular formula for Bdenoughium is...
asked 1 hour ago -
5. A car decelerate evenly from a velocity of 50mph until rest
in a distance of...
asked 1 hour ago -
IN HTML Programming
1. Write a script that inputs integers (one at a time) and
passes...
asked 1 hour ago -
A dentist uses a mirror to examine a tooth that is 0.75 cm in
front of...
asked 1 hour ago -
You set up a 100,000 line of credit for the business on 1/1/X8,
annual interest is...
asked 1 hour ago -
What is the measurement uncertainty of a pan balance? How did you
get that?
asked 1 hour ago -
Suppose four firms have market shares of 30%, 30%, 20% and 20%.
What is the Herfindahl-Hirschman...
asked 2 hours ago -
IBT Industrial Solutions produces forty units of rack and pinion
type steering gears during an eight...
asked 2 hours ago -
The Ksp for PbI2 is 9.8×10⁻⁹ . Will PbI2 precipitate if 2.5 mL
of 0.0025 M...
asked 2 hours ago -
- Write a Person Constructor that initializes `name` and
`age` from arguments.
- All instances of...
asked 2 hours ago -
What is the meaning of the statement: In acid-base catalysis,
acid catalysis involves partial proton transfer...
asked 2 hours ago -
Polo Publishers purchased a multi-color offset press with terms
of $65,000 down and a noninterest-bearing note...
asked 2 hours ago