
Homework Answers
Calculate the required using excel values and formula:
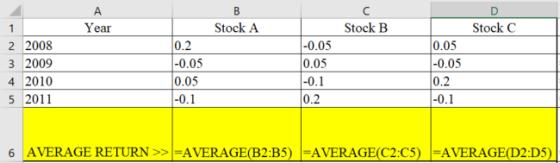


The values will appear as follows:


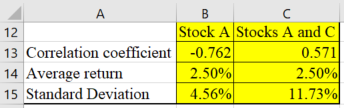
Carlos will be better off choosing portfolio AB because it has stronger negative correlation close to -1.
The higher the stocks' correlation coefficients, the lower the portfolio's risk is correct.
The risk of apertfolio declines as the number of stocks in the portfolio increases is correct.
Add Answer to:
Using historical data to measure portfolio risk and correlation coefficient Carlos is an investor who believes...
7. Using historical data to measure portfolio risk and correlation coefficient Peter is an investor who...
7. Using historical data to measure portfolio risk and correlation coefficient Peter is an investor who believes that past variability of stocks is a reasonably good estimate of future risk associated with the stocks. Peter works on creating a new portfolio and has already purchased stock A. Now he considers two other stocks, B and C. Peter collected data on the historic rates of return for all three stocks, which are presented in the following table. Complete the table by...
I ONLY CAN SHOW ONE OPTIONS OF THEM 7. Using historical data to measure portfolio risk...
 I ONLY CAN SHOW ONE OPTIONS OF THEM
7. Using historical data to measure portfolio risk and correlation coefficient Aa Aa Pam is an investor who believes that past variability of stocks is a reasonably good estimate of future risk associated with the stocks. Pam works on creating a new portfolio and has already purchased stock A. Now she considers two other stocks, B and C. Pam collected data on the historic rates of return for all three stocks, which...
I ONLY CAN SHOW ONE OPTIONS OF THEM
7. Using historical data to measure portfolio risk and correlation coefficient Aa Aa Pam is an investor who believes that past variability of stocks is a reasonably good estimate of future risk associated with the stocks. Pam works on creating a new portfolio and has already purchased stock A. Now she considers two other stocks, B and C. Pam collected data on the historic rates of return for all three stocks, which...
Attention:Due to a bug in Google Chrome, this page may not function correctly. Click hare to...
 Attention:Due to a bug in Google Chrome, this page may not function correctly. Click hare to lsarn mare 7. Using historical data to measure portfolio risk and correlation coefficient Aa Aa Michael is an investor who believes that past variability of stocks is a reasonably good estimate of future risk associated with the stocks. Michael works on creating a new portfolio and has already purchased stock A. Now he considers two other stocks, B and C. Michael collected data on...
Please answer Which of the following statements about portfolio diversifications are correct? Check all that apply....
 Please answer
Which of the following statements about portfolio diversifications are correct? Check all that apply. The higher the stocks' correlation coefficients,the lower the portfolio's risk. Stocks with perfectly negatively correlated returns do not exist. By adding enough partially correlated stocks, risk can be completely eliminated The risk of a portfolio declines as the number of stocks in the portfolio increases.
Please answer
Which of the following statements about portfolio diversifications are correct? Check all that apply. The higher the stocks' correlation coefficients,the lower the portfolio's risk. Stocks with perfectly negatively correlated returns do not exist. By adding enough partially correlated stocks, risk can be completely eliminated The risk of a portfolio declines as the number of stocks in the portfolio increases.
2. 3: Risk and Rates of Return: Risk in Portfolio Context Risk and Rates of Return:...
 2. 3: Risk and Rates of Return: Risk in Portfolio Context Risk
and Rates of Return: Risk in Portfolio Context The capital asset
pricing model (CAPM) explains how risk should be considered when
stocks and other assets are held . The CAPM states that any stock's
required rate of return is the risk-free rate of return plus a risk
premium that reflects only the risk remaining diversification. Most
individuals hold stocks in portfolios. The risk of a stock held in...
2. 3: Risk and Rates of Return: Risk in Portfolio Context Risk
and Rates of Return: Risk in Portfolio Context The capital asset
pricing model (CAPM) explains how risk should be considered when
stocks and other assets are held . The CAPM states that any stock's
required rate of return is the risk-free rate of return plus a risk
premium that reflects only the risk remaining diversification. Most
individuals hold stocks in portfolios. The risk of a stock held in...
2. Portfolio risk and diversification A financial planner is examining the portfolios held by several of...
 2. Portfolio risk and diversification A financial planner is examining the portfolios held by several of her clients. Identify which of the following portfolios is likely to have the smallest standard deviation: A portfolio with 10 randomly selected stocks from U.S. and international markets A portfolio with 10 randomly selected international stocks A portfolio with 10 randomly selected U.S. stocks Portfolio managers pick stocks for their clients' portfolios based on the investment objective of the portfolio and several other factors....
3. Portfolio risk and diversification Aa Aa E A financial planner is examining the portfolios held...
 3. Portfolio risk and diversification Aa Aa E A financial planner is examining the portfolios held by several of her clients. Which of the following portfolios is likely to have the smallest standard deviation? O O O A portfolio containing only Chevron stock A portfolio consisting of about 30 energy stocks A portfolio consisting of about 30 randomly selected stocks Portfolio managers pick stocks for their clients' portfolios based on the investment objective of the portfolio and several other factors....
3. Portfolio risk and diversification Aa Aa A financial planner is examining the portfolios held by...
 3. Portfolio risk and diversification Aa Aa A financial planner is examining the portfolios held by several of her clients. Which of the following portfolios is likely to have the smallest standard deviation ? A portfolio with 10 randomly selected international stocks A portfolio with 10 randomly selected U.S. stocks A portfolio with 10 randomly selected stocks from U.S. and international markets Portfolio managers pick stocks for their clients' portfolios based on the investment objective of the portfolio and several...
please answer 6. Calculating a beta coefficient for a single stock Aa Aa Suppose that the...
 please answer
6. Calculating a beta coefficient for a single stock Aa Aa Suppose that the standard deviation of returns for a single stock A is σΑ-30%, and the standard deviation of the market return is 얘-10%. If the correlation between stock A and the market is ρΑΜ-0.3, then the stock's beta is Is it reasonable to expect that the volatility of the market portfolio's future expected returns will be greater than the volatility of stock A's returns? O Yes...
please answer
6. Calculating a beta coefficient for a single stock Aa Aa Suppose that the standard deviation of returns for a single stock A is σΑ-30%, and the standard deviation of the market return is 얘-10%. If the correlation between stock A and the market is ρΑΜ-0.3, then the stock's beta is Is it reasonable to expect that the volatility of the market portfolio's future expected returns will be greater than the volatility of stock A's returns? O Yes...
 I ONLY CAN SHOW ONE OPTIONS OF THEM
7. Using historical data to measure portfolio risk and correlation coefficient Aa Aa Pam is an investor who believes that past variability of stocks is a reasonably good estimate of future risk associated with the stocks. Pam works on creating a new portfolio and has already purchased stock A. Now she considers two other stocks, B and C. Pam collected data on the historic rates of return for all three stocks, which...
I ONLY CAN SHOW ONE OPTIONS OF THEM
7. Using historical data to measure portfolio risk and correlation coefficient Aa Aa Pam is an investor who believes that past variability of stocks is a reasonably good estimate of future risk associated with the stocks. Pam works on creating a new portfolio and has already purchased stock A. Now she considers two other stocks, B and C. Pam collected data on the historic rates of return for all three stocks, which...
 Attention:Due to a bug in Google Chrome, this page may not function correctly. Click hare to lsarn mare 7. Using historical data to measure portfolio risk and correlation coefficient Aa Aa Michael is an investor who believes that past variability of stocks is a reasonably good estimate of future risk associated with the stocks. Michael works on creating a new portfolio and has already purchased stock A. Now he considers two other stocks, B and C. Michael collected data on...
 Please answer
Which of the following statements about portfolio diversifications are correct? Check all that apply. The higher the stocks' correlation coefficients,the lower the portfolio's risk. Stocks with perfectly negatively correlated returns do not exist. By adding enough partially correlated stocks, risk can be completely eliminated The risk of a portfolio declines as the number of stocks in the portfolio increases.
Please answer
Which of the following statements about portfolio diversifications are correct? Check all that apply. The higher the stocks' correlation coefficients,the lower the portfolio's risk. Stocks with perfectly negatively correlated returns do not exist. By adding enough partially correlated stocks, risk can be completely eliminated The risk of a portfolio declines as the number of stocks in the portfolio increases.
 2. 3: Risk and Rates of Return: Risk in Portfolio Context Risk
and Rates of Return: Risk in Portfolio Context The capital asset
pricing model (CAPM) explains how risk should be considered when
stocks and other assets are held . The CAPM states that any stock's
required rate of return is the risk-free rate of return plus a risk
premium that reflects only the risk remaining diversification. Most
individuals hold stocks in portfolios. The risk of a stock held in...
2. 3: Risk and Rates of Return: Risk in Portfolio Context Risk
and Rates of Return: Risk in Portfolio Context The capital asset
pricing model (CAPM) explains how risk should be considered when
stocks and other assets are held . The CAPM states that any stock's
required rate of return is the risk-free rate of return plus a risk
premium that reflects only the risk remaining diversification. Most
individuals hold stocks in portfolios. The risk of a stock held in...
 2. Portfolio risk and diversification A financial planner is examining the portfolios held by several of her clients. Identify which of the following portfolios is likely to have the smallest standard deviation: A portfolio with 10 randomly selected stocks from U.S. and international markets A portfolio with 10 randomly selected international stocks A portfolio with 10 randomly selected U.S. stocks Portfolio managers pick stocks for their clients' portfolios based on the investment objective of the portfolio and several other factors....
 3. Portfolio risk and diversification Aa Aa E A financial planner is examining the portfolios held by several of her clients. Which of the following portfolios is likely to have the smallest standard deviation? O O O A portfolio containing only Chevron stock A portfolio consisting of about 30 energy stocks A portfolio consisting of about 30 randomly selected stocks Portfolio managers pick stocks for their clients' portfolios based on the investment objective of the portfolio and several other factors....
 3. Portfolio risk and diversification Aa Aa A financial planner is examining the portfolios held by several of her clients. Which of the following portfolios is likely to have the smallest standard deviation ? A portfolio with 10 randomly selected international stocks A portfolio with 10 randomly selected U.S. stocks A portfolio with 10 randomly selected stocks from U.S. and international markets Portfolio managers pick stocks for their clients' portfolios based on the investment objective of the portfolio and several...
 please answer
6. Calculating a beta coefficient for a single stock Aa Aa Suppose that the standard deviation of returns for a single stock A is σΑ-30%, and the standard deviation of the market return is 얘-10%. If the correlation between stock A and the market is ρΑΜ-0.3, then the stock's beta is Is it reasonable to expect that the volatility of the market portfolio's future expected returns will be greater than the volatility of stock A's returns? O Yes...
please answer
6. Calculating a beta coefficient for a single stock Aa Aa Suppose that the standard deviation of returns for a single stock A is σΑ-30%, and the standard deviation of the market return is 얘-10%. If the correlation between stock A and the market is ρΑΜ-0.3, then the stock's beta is Is it reasonable to expect that the volatility of the market portfolio's future expected returns will be greater than the volatility of stock A's returns? O Yes...
Most questions answered within 3 hours.
-
IN PYTHON ONLY !! Program 2: Re-work
program #5 (WeeklyHours) from the previous assignment such that...
asked 9 minutes ago -
The average length of time between arrivals at a turnpike
toll-booth is 26 seconds. What is...
asked 1 hour ago -
(a) A piston at 6.1 atm contains a gas that occupies a volume of
3.5 L....
asked 3 hours ago -
Please answer true or false. Words
cannot be changed or added in to make it true...
asked 3 hours ago -
An empty test tube weighs 15.923 grams. Then,
MgCl2•6H2O is added into the test tube. After...
asked 3 hours ago -
Assume memory access is 10 units of time and disk access is
10000 units of time....
asked 3 hours ago -
1. Are all good samples random?
2. Magazines often report surveys giving statistics such as “63%...
asked 3 hours ago -
Under all the various types of market structures, firms
must eventually earn some economic profits for...
asked 3 hours ago -
Consider the following fitness regime for a single locus trait
with two co-dominant alleles: w11 =...
asked 3 hours ago -
A large cable company reports the following.
80% of its customers subscribe to its cable TV...
asked 3 hours ago -
Please answer the question in brief.
Discuss the role of ERP in organizations. Are ERP tools...
asked 3 hours ago -
Discuss the pros and cons of collaborative software such
as SameTime. Does it increase productivity? What...
asked 3 hours ago