
Homework Answers
1.(a)
R code:
x=c(1.12,0.44,-1.49,0.02,0.81,-1.34,1.34,0.51,-0.12,0.97)
S=sum(x)
M=S/length(x)# Method 1 Q1(a)
M
mean(x)# Method 2 Q1(a)
Output:
> M=S/length(x)# Method 1 Q1(a)
> M
[1] 0.226
> mean(x)# Method 2 Q1(a)
[1] 0.226
1(b)
R code:
x=c(1.12,0.44,-1.49,0.02,0.81,-1.34,1.34,0.51,-0.12,0.97)
S=sum(x)
M=S/length(x)
SS=sum(x^2)
SSW=SS-length(x)*M^2
Var=SSW/(length(x)-1)# Method 1 Q1(b)
Var
var(x)# Method 2 Q1(b)
Output:
> Var
[1] 0.9578267
> var(x)# Method 2 Q1(b)
[1] 0.9578267
1(c)
R code:
sd(x)
Output:
[1] 0.9786862
2.
(a)
R code:
x=rt(1000,2)
quantile(x,0.95)
Output:
> quantile(x,0.95)
95%
2.88103
(b)
R code:
x=rt(1000,2)
quantile(x,0.95)
shapiro.test(x)
Output:
> shapiro.test(x)
Shapiro-Wilk normality test
data: x
W = 0.87789, p-value < 2.2e-16
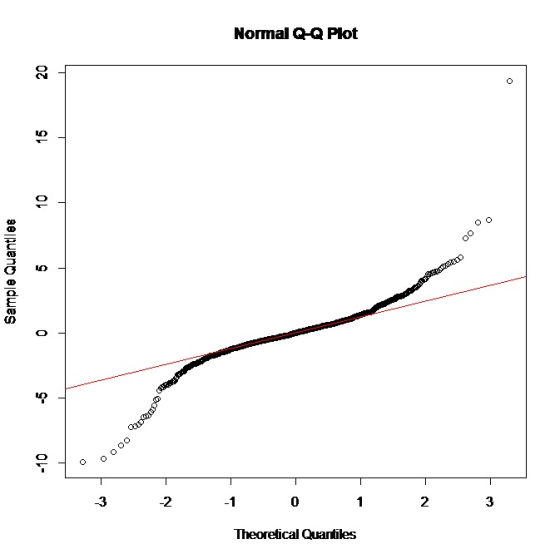
(c)
R code:
x=rt(1000,2)
quantile(x,0.95)
qqnorm(x)
qqline(x, col = 2)
(d)
R code:
x=rt(1000,100)
quantile(x,0.95)
shapiro.test(x)
qqnorm(x)
qqline(x, col = 2)
Output:
> quantile(x,0.95)
95%
1.561231
> shapiro.test(x)
Shapiro-Wilk normality test
data: x
W = 0.99618, p-value = 0.0147

Add Answer to:
What is the code and result in Rstudio or R 1. Suppose we have a random...
Suppose we assume that X1, X2, . . . , Xn is a random sample from...
 Suppose we assume that X1, X2, . . . , Xn is a random sample from a「(1, θ) distribution a) Show that the random variable (2/0) X has a x2 distribution with 2n degrees of freedom. (b) Using the random variable in part (a) as a pivot random variable, find a (1-a) 100% confidence interval for
1. Suppose Yi, ½ . . . , Yn is a random sample of n independent observations from a distribution ...
 1. Suppose Yi, ½ . . . , Yn is a random sample of n independent observations from a distribution with pdf 202 fY()otherwise. (a) Find the MLE for θ (c) Use the pivotal quantity to find a 100(1-a)% CI for θ
1. Suppose Yi, ½ . . . , Yn is a random sample of n independent observations from a distribution with pdf 202 fY()otherwise. (a) Find the MLE for θ (c) Use the pivotal quantity to find a...
1. Suppose Yi, ½ . . . , Yn is a random sample of n independent observations from a distribution with pdf 202 fY()otherwise. (a) Find the MLE for θ (c) Use the pivotal quantity to find a 100(1-a)% CI for θ
1. Suppose Yi, ½ . . . , Yn is a random sample of n independent observations from a distribution with pdf 202 fY()otherwise. (a) Find the MLE for θ (c) Use the pivotal quantity to find a...
Suppose that we wish to generate observations from the discrete distribution 3 a) Suppose that we...
 Suppose that we wish to generate observations from the discrete
distribution
3 a) Suppose that we wish to generate observations from the discrete distribution with probability mass function 2)+1 20 x=1,2, 3, 4, 5 Clearly describe the algorithm to do this and give the random numbers corresponding to the following uniform(0,1) sample. 0.5197 0.1790 0.9994 0.6873 0.7294 0.5791 0.0361 0.2581 0.0026 0.8213 NB: Do not use R for this part of the question. two numbers rolled. Write an R function...
Suppose that we wish to generate observations from the discrete
distribution
3 a) Suppose that we wish to generate observations from the discrete distribution with probability mass function 2)+1 20 x=1,2, 3, 4, 5 Clearly describe the algorithm to do this and give the random numbers corresponding to the following uniform(0,1) sample. 0.5197 0.1790 0.9994 0.6873 0.7294 0.5791 0.0361 0.2581 0.0026 0.8213 NB: Do not use R for this part of the question. two numbers rolled. Write an R function...
11. For a random sample of size 13 from a normal distribution with mean u, you...
 11. For a random sample of size 13 from a normal distribution with mean u, you are given the following regarding the observations: (ti – 1)2 = 77.8 The width of the 100% confidence interval for u is 2.7005. Let tay be the critical value of a t random variable with v degrees of freedom. The following table lists values of tay for specific combinations of a and v: v = 12 v=13 a=0.1 1.356 1.350 a= 0.07 1.580 1.572...
1. Suppose that Xi,..,Xn are independent Exponential random variables with density f(x; λ) λ exp(-1x) for...
 1. Suppose that Xi,..,Xn are independent Exponential random variables with density f(x; λ) λ exp(-1x) for x > 0 where λ > 0 is an unknown parameter (a) Show that the τ quantile of the Exponential distribution is F-1 (r)--X1 In(1-7) and give an approximation to Var(X(k)) for k/n-T. What happens to this variance as τ moves from 0 to 1? (b) The form of the quantile function in part (a) can be used to give a quantile-quantile (QQ) plot...
1- Suppose a simple random sample of sizen is drawn froma large population with mean u...
 1- Suppose a simple random sample of sizen is drawn froma large population with mean u and standard deviation o. The sampling distribution of x has mean ug and standard deviation= 2- As the number of degrees of freedom in the t-distribution increase, the spread of the distribution 3- True or False: The value of to.10 with 5 degrees of freedom is greater than the value of to.10 with 10 degrees of freedom. 4- True or False: To construct a...
Suppose a random sample of 17 is selected from a normal distribution and the sample mean...
Suppose a random sample of 17 is selected from a normal distribution and the sample mean x-bar = 102.5 and the sample standard deviation Sx = 4.3. Is this a z distribution or a t distribution? A. t distribution with 17 degrees of freedom B. t distribution with 16 degrees of freedom C. z distribution D. Cannot be determined Part b construct a 96% confidence interval for the population mean A. 100.17 to 104.83 B. 100.36 to 104.64 C. 100.00...
Solve for 1 and 2: 1) Suppose we were to gather a random sample of 15...
Solve for 1 and 2: 1) Suppose we were to gather a random sample of 15 observations from a population and wished to calculate an 80% confidence interval for the mean, µ, in the case where the population standard deviation, σ, is unknown. Enter the value from the Student's t distribution that we would use, to three decimal places. 2)A random sample of 51 undergraduate statistics students resulted in a sample mean age of 22.1 years, with a sample standard...
What is the R code and result in Rstudio 1. The following data gives, for each...
 What is the R code and result in Rstudio
1. The following data gives, for each amount by which an elastic band is stretched over the end of a ruler, the distance that the band moved when released: stretch 46 54 48 50 44 4 52 distance 148 182 173166 109 141 166 Create a data frame in R with two columns that contain "stretch and "dis tance" respectively. Plot the distance versus the stretch using plot) function What trend...
What is the R code and result in Rstudio
1. The following data gives, for each amount by which an elastic band is stretched over the end of a ruler, the distance that the band moved when released: stretch 46 54 48 50 44 4 52 distance 148 182 173166 109 141 166 Create a data frame in R with two columns that contain "stretch and "dis tance" respectively. Plot the distance versus the stretch using plot) function What trend...
 Suppose we assume that X1, X2, . . . , Xn is a random sample from a「(1, θ) distribution a) Show that the random variable (2/0) X has a x2 distribution with 2n degrees of freedom. (b) Using the random variable in part (a) as a pivot random variable, find a (1-a) 100% confidence interval for
 1. Suppose Yi, ½ . . . , Yn is a random sample of n independent observations from a distribution with pdf 202 fY()otherwise. (a) Find the MLE for θ (c) Use the pivotal quantity to find a 100(1-a)% CI for θ
1. Suppose Yi, ½ . . . , Yn is a random sample of n independent observations from a distribution with pdf 202 fY()otherwise. (a) Find the MLE for θ (c) Use the pivotal quantity to find a...
1. Suppose Yi, ½ . . . , Yn is a random sample of n independent observations from a distribution with pdf 202 fY()otherwise. (a) Find the MLE for θ (c) Use the pivotal quantity to find a 100(1-a)% CI for θ
1. Suppose Yi, ½ . . . , Yn is a random sample of n independent observations from a distribution with pdf 202 fY()otherwise. (a) Find the MLE for θ (c) Use the pivotal quantity to find a...
 Suppose that we wish to generate observations from the discrete
distribution
3 a) Suppose that we wish to generate observations from the discrete distribution with probability mass function 2)+1 20 x=1,2, 3, 4, 5 Clearly describe the algorithm to do this and give the random numbers corresponding to the following uniform(0,1) sample. 0.5197 0.1790 0.9994 0.6873 0.7294 0.5791 0.0361 0.2581 0.0026 0.8213 NB: Do not use R for this part of the question. two numbers rolled. Write an R function...
Suppose that we wish to generate observations from the discrete
distribution
3 a) Suppose that we wish to generate observations from the discrete distribution with probability mass function 2)+1 20 x=1,2, 3, 4, 5 Clearly describe the algorithm to do this and give the random numbers corresponding to the following uniform(0,1) sample. 0.5197 0.1790 0.9994 0.6873 0.7294 0.5791 0.0361 0.2581 0.0026 0.8213 NB: Do not use R for this part of the question. two numbers rolled. Write an R function...
 11. For a random sample of size 13 from a normal distribution with mean u, you are given the following regarding the observations: (ti – 1)2 = 77.8 The width of the 100% confidence interval for u is 2.7005. Let tay be the critical value of a t random variable with v degrees of freedom. The following table lists values of tay for specific combinations of a and v: v = 12 v=13 a=0.1 1.356 1.350 a= 0.07 1.580 1.572...
 1. Suppose that Xi,..,Xn are independent Exponential random variables with density f(x; λ) λ exp(-1x) for x > 0 where λ > 0 is an unknown parameter (a) Show that the τ quantile of the Exponential distribution is F-1 (r)--X1 In(1-7) and give an approximation to Var(X(k)) for k/n-T. What happens to this variance as τ moves from 0 to 1? (b) The form of the quantile function in part (a) can be used to give a quantile-quantile (QQ) plot...
 1. Suppose that Xi,..,Xn are independent Exponential random variables with density f(x; λ) λ exp(-1x) for x > 0 where λ > 0 is an unknown parameter (a) Show that the τ quantile of the Exponential distribution is F-1 (r)--X1 In(1-7) and give an approximation to Var(X(k)) for k/n-T. What happens to this variance as τ moves from 0 to 1? (b) The form of the quantile function in part (a) can be used to give a quantile-quantile (QQ) plot...
 1- Suppose a simple random sample of sizen is drawn froma large population with mean u and standard deviation o. The sampling distribution of x has mean ug and standard deviation= 2- As the number of degrees of freedom in the t-distribution increase, the spread of the distribution 3- True or False: The value of to.10 with 5 degrees of freedom is greater than the value of to.10 with 10 degrees of freedom. 4- True or False: To construct a...
 What is the R code and result in Rstudio
1. The following data gives, for each amount by which an elastic band is stretched over the end of a ruler, the distance that the band moved when released: stretch 46 54 48 50 44 4 52 distance 148 182 173166 109 141 166 Create a data frame in R with two columns that contain "stretch and "dis tance" respectively. Plot the distance versus the stretch using plot) function What trend...
What is the R code and result in Rstudio
1. The following data gives, for each amount by which an elastic band is stretched over the end of a ruler, the distance that the band moved when released: stretch 46 54 48 50 44 4 52 distance 148 182 173166 109 141 166 Create a data frame in R with two columns that contain "stretch and "dis tance" respectively. Plot the distance versus the stretch using plot) function What trend...
Most questions answered within 3 hours.
-
Write a program to solve the Josephus problem, with the following
modification:
Sample Input:
./a.out n...
asked 2 hours ago -
At the start of a CD it is spinning at a rate of 525 rpm
(revolutions...
asked 2 hours ago -
4. Without doing any calculations, predict whether the observed
∆T would increase, decrease or remain the...
asked 4 hours ago -
Based on the range, which of the following sets of scores has
the greatest variability? 3,...
asked 5 hours ago -
Ripples in a pond travel at a velocity of 3 m/s with one peak
passing a...
asked 5 hours ago -
A man stands on the roof of a building of height 13.0 mm and
throws a...
asked 5 hours ago -
The extent to which assets are financed by borrowed funds and
other liabilities is indicated by:...
asked 6 hours ago -
Explain in detail
Germany is the fifth largest economy
explain what goods and services Germany specializes...
asked 6 hours ago -
The density of platinum is 21.45 g/mL. If a cube of platinum
with a mass of...
asked 6 hours ago -
Accounts Receivable
Sales
A/R Posting
Extended Sales Invoice
Packing Slip
Compare invoice to packing slip 2...
asked 6 hours ago -
Michaella, age 23, is a full-time law student and is claimed by
her parents as a...
asked 6 hours ago -
Why are polymers not typically casted into products?
asked 6 hours ago