
Homework Answers
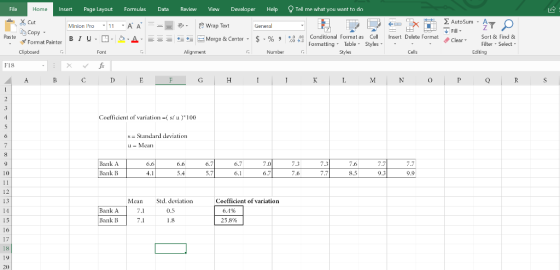
6.4%
25.8%
C. The waiting times at Bank A have considerably less variation than the waiting times at Bank B.
Add Answer to:
number 13 Waiting times (in minutes) of customers at a bank where all customers enter a...
The data table contains waiting times of customers at a bank, where customers enter a single...
The data table contains waiting times of customers at a bank, where customers enter a single waiting line that feeds three teller windows. Test the claim that the standard deviation of waiting times is less than 2.4 minutes, which is the standard deviation of waiting times at the same bank when separate waiting lines are used at each teller window. Use a significance level of 0.01. Complete parts (a) through (d) below. Customer Waiting Times (in minutes) 7.5 6.5 9.2...
Waiting times (in minutes) of customers in a bank where all customers enter a single waiting...
Waiting times (in minutes) of customers in a bank where all customers enter a single waiting line and a bank where customers wait in individual lines at three different teller windows are listed below. Find the mean and median for each of the two samples, then compare the two sets of results. Single Line 6.56.5 6.66.6 6.76.7 6.86.8 7.17.1 7.27.2 7.47.4 7.87.8 7.87.8 7.87.8 Individual Lines 4.44.4 5.45.4 5.95.9 6.26.2 6.56.5 7.87.8 7.87.8 8.58.5 9.39.3 9.99.9 The mean waiting time...
The values listed below are waiting times in minutes) of customers at two different banks. At...
 The values listed below are waiting times in minutes) of customers at two different banks. At Bank A, customers enter a single waiting line that feeds three teller windows. At Bank B, customers may enter any one of three different lines that have formed at three teller windows. Answer the following questions. Bank A 6.4 6.6 6.7 6.8 7.1 7.3 7.6 7.7 7.7 Bank B 7.7 4.2 5.4 5.9 6.1 6.6 7.8 7.8 8.5 9.3 10.0 3 Click the icon...
The values listed below are waiting times (in minutes) of customers at two different banks. At...
The values listed below are waiting times (in minutes) of customers at two different banks. At Bank A, customers enter a single waiting line that feeds three teller windows. At Bank B, customers may enter any one of three different lines that have formed at three teller windows. Answer the following questions. Bank A 6.5 6.6 6.7 6.8 7.1 7.2 7.5 7.7 7.7 7.7 Bank Upper B 4.2 5.3 5.7 6.3 6.6 7.7 7.7 8.5 9.3 10.0 . Click the...
7.3.16-T Question Help The values listed below are waiting times (in minutes) of customers at two...
 7.3.16-T Question Help The values listed below are waiting times (in minutes) of customers at two different banks. At Bank A, customers enter a single waiting line that feeds three teller windows. At Bank B, customers may enter any one of three different lines that have formed at three teller windows. Answer the following questions Bank A 6.3 6.6 6.7 6.8 73 7.7 Bank B 4.2 5.5 57 6.3 8.6 94 10.0 Click the icon to view the table of...
The values listed below are waiting times (in minutes) of customers at two different banks
Bank_A Bank_B 6.4 4.3 6.6 5.5 6.7 5.8 6.8 6.2 7.1 6.7 7.2 7.8 7.6 7.8 7.8 8.4 7.8 9.4 7.8 10 The values listed below are waiting times (in minutes) of customers at two different banks. At Bank A, customers enter a single waiting line that feeds three teller windows. At Bank B, customers may enter any one of three different lines that have formed at three teller windows. Answer the following questions.Constructaa9999%confidence interval for the population standard deviationsigmaσat Bank A.nothingminless than<sigma Subscript Bank Upper AσBank Aless than< nothingmin(Round to...
The data table contains waiting times of customers at a bank, where customers enter a single...
The data table contains waiting times of customers at a bank, where customers enter a single waiting line that feeds three teller windows. Test the claim that the standard deviation of waiting times is less than 2.2 minutes, which is the standard deviation of waiting times at the same bank when separate waiting lines are used at each teller window. Use a significance level of .05. Complete parts (a) through (d) below Compute the test statistic. Find the p value
The data table contains waiting times of customers at a bank, where customers enter a single...
 The
data table contains waiting times of customers at a bank, where
customers enter a single waiting line that feeds three teller
windows. Test the claim that the standard deviation of waiting
times is less than. 1.5 minutes, which is the standard deviation of
waiting times at the same bank when separate waiting lines are used
at each teller window. Use the significance level of 0.025.
Please help with part B and C
C.) find the P value
567-33211653832 676776678676766...
The
data table contains waiting times of customers at a bank, where
customers enter a single waiting line that feeds three teller
windows. Test the claim that the standard deviation of waiting
times is less than. 1.5 minutes, which is the standard deviation of
waiting times at the same bank when separate waiting lines are used
at each teller window. Use the significance level of 0.025.
Please help with part B and C
C.) find the P value
567-33211653832 676776678676766...
The data table contains waiting times of customers at a bank, where customers enter a single waiting line that feeds three teller windows
The data table contains waiting times of customers at a bank, where customers enter a single waiting line that feeds three teller windows. Test the claim that the standard deviation of waiting times is less than 2.2 minutes, which is the standard deviation of waiting times at the same bank when separate waiting lines are used at each teller window. Use a significance level of .05. Complete parts (a) through (d) below Compute the test statistic. Find the p-value.
lues listed are waiting times (in minutes) of customers at the Jeffterson Bank, where (1 pomt)...
 lues listed are waiting times (in minutes) of customers at the Jeffterson Bank, where (1 pomt) customers enter a single waiting line that feeds three teller windows. Find the critical values 21 and 2 corresponding to a 95% confidence level 65 6.6 6.7 6.8 7.1 73 74 77 7.7 77 3.325, 16.919 2.700, 19.023 3247, 20483 1.237, 14.449 5. Given a sample size of 20, what are the critical values 22 and for a 95% confidence level? (1 point) 8.907,...
 The values listed below are waiting times in minutes) of customers at two different banks. At Bank A, customers enter a single waiting line that feeds three teller windows. At Bank B, customers may enter any one of three different lines that have formed at three teller windows. Answer the following questions. Bank A 6.4 6.6 6.7 6.8 7.1 7.3 7.6 7.7 7.7 Bank B 7.7 4.2 5.4 5.9 6.1 6.6 7.8 7.8 8.5 9.3 10.0 3 Click the icon...
 7.3.16-T Question Help The values listed below are waiting times (in minutes) of customers at two different banks. At Bank A, customers enter a single waiting line that feeds three teller windows. At Bank B, customers may enter any one of three different lines that have formed at three teller windows. Answer the following questions Bank A 6.3 6.6 6.7 6.8 73 7.7 Bank B 4.2 5.5 57 6.3 8.6 94 10.0 Click the icon to view the table of...
 The
data table contains waiting times of customers at a bank, where
customers enter a single waiting line that feeds three teller
windows. Test the claim that the standard deviation of waiting
times is less than. 1.5 minutes, which is the standard deviation of
waiting times at the same bank when separate waiting lines are used
at each teller window. Use the significance level of 0.025.
Please help with part B and C
C.) find the P value
567-33211653832 676776678676766...
The
data table contains waiting times of customers at a bank, where
customers enter a single waiting line that feeds three teller
windows. Test the claim that the standard deviation of waiting
times is less than. 1.5 minutes, which is the standard deviation of
waiting times at the same bank when separate waiting lines are used
at each teller window. Use the significance level of 0.025.
Please help with part B and C
C.) find the P value
567-33211653832 676776678676766...
 lues listed are waiting times (in minutes) of customers at the Jeffterson Bank, where (1 pomt) customers enter a single waiting line that feeds three teller windows. Find the critical values 21 and 2 corresponding to a 95% confidence level 65 6.6 6.7 6.8 7.1 73 74 77 7.7 77 3.325, 16.919 2.700, 19.023 3247, 20483 1.237, 14.449 5. Given a sample size of 20, what are the critical values 22 and for a 95% confidence level? (1 point) 8.907,...
Most questions answered within 3 hours.
-
Calculate the pH of each of the following solutions.
0.50 M HBr
3.1×10⁻⁴ M KOH
4.2×10⁻⁵...
asked 2 hours ago -
For the year ended December 31, Depot Max’s cost of merchandise
sold was $85,600. Inventory at the...
asked 2 hours ago -
Week 10 - Professional Memo Assignment
Professional Memo Assignment
Your mission for this week, should you...
asked 2 hours ago -
Write a Python program that stores the data for each
player on the team, and it...
asked 3 hours ago -
In
the last 3 months, mike never knows when he is going to get his
allowance...
asked 3 hours ago -
Is Ca(OH)2 a Bronsted base, Lewis base, or both? Why?
asked 3 hours ago -
1A- Why don’t voters complain about U.S. tariffs on imported
sugar?
Because sugar is only a...
asked 3 hours ago -
Cash Payback Period
Primera Banco is evaluating two capital investment proposals for
a drive-up ATM kiosk,...
asked 3 hours ago -
Create a button in Swift (Xcode) that will create a charge,
create a charge using Stripe's...
asked 3 hours ago -
The reaction rate of CO and NO2 in the reaction
CO(g) + NO2(g) → CO2(g) +...
asked 3 hours ago -
Imagine that a chemist puts 6.40 mol each of
C3H8 and O2 in a 1.00-L container...
asked 3 hours ago -
How much money should be invested today in order to have $8340
at the end of...
asked 3 hours ago