Use the date in Figure 15.1to calculate both the payoff and the profit or loss per share for the investments in each of the following July 2017 expiration options, if the stock price on the expiration date is $72. (Loss amounts should be indicated by a minus sign. Round Profit/Loss to 2 decimal places.)
| Payoff | Profit/Loss | ||
| a. | Call option, X = 70 | 2.00selected answer correct | (0.02)selected answer incorrect |
| b. | Put option, X = 70 | 0.00selected answer correct | (0.24)selected answer incorrect |
| c. | Call option, X = 72 | 0.00selected answer correct | (0.67)selected answer incorrect |
| d. | Put option, X = 72 | 0.00selected answer correct | (0.90)selected answer incorrect |
| e. | Call option, X = 74 | 0.00selected answer correct | (0.13)selected answer incorrect |
| f. | Put option, X = 74 | 2.00selected answer correct | (0.37) |
I got the first column correct, I need help on the second column where the answers are all incorrect.
Figure 15.1:

Homework Answers
SEE THE IMAGE. ANY DOUBTS, FEEL FREE TO ASK. THUMBS UP PLEASE
You have done sum correctly conceptually but put June
premium figures instead of July premium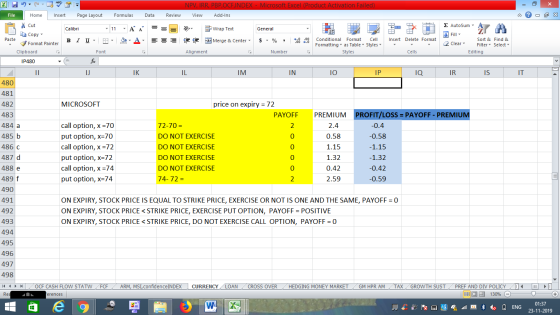
Add Answer to:
Use the date in Figure 15.1to calculate both the payoff and the profit or loss per...
Refer to Figure 15.1, which lists the prices of various Microsoft options. Use the data in...
 Refer to Figure 15.1, which lists the prices of various
Microsoft options. Use the data in the figure to calculate the
payoff and the profit/loss for investments in each of the following
June 2017 expiration options on a single share, assuming that the
stock price on the expiration date is $82. (Leave no cells blank -
be certain to enter "0" wherever required. Loss amounts should be
indicated by a minus sign. Round "Profit/Loss" to 2 decimal
places.)
figure 15.1...
Refer to Figure 15.1, which lists the prices of various
Microsoft options. Use the data in the figure to calculate the
payoff and the profit/loss for investments in each of the following
June 2017 expiration options on a single share, assuming that the
stock price on the expiration date is $82. (Leave no cells blank -
be certain to enter "0" wherever required. Loss amounts should be
indicated by a minus sign. Round "Profit/Loss" to 2 decimal
places.)
figure 15.1...
Refer to Figure 15.1, which lists the prices of various Microsoft options. Use the data in...
 Refer to Figure 15.1, which lists the prices of various Microsoft options. Use the data in the figure to calculate the payoff and the profits for investments in each of the following June 2017 expiration options, assuming that the stock price on the expiration date is $71. (Leave no cells blank - be certain to enter "O" wherever required. Loss amounts should be indicated by a minus sign. Round "Profit/Loss"to 2 decimal places.) Payoff Profit/Loss a. Call option, X =...
Refer to Figure 15.1, which lists the prices of various Microsoft options. Use the data in...
 Refer to Figure 15.1, which lists the prices of various
Microsoft options. Use the data in the figure to calculate the
payoff and the profits for investments in each of the following
June 2017 expiration options, assuming that the stock price on the
expiration date is $71. (Leave no cells blank - be certain
to enter "0" wherever required. Loss amounts should be indicated by
a minus sign. Round "Profit/Loss"to 2 decimal places.)
(figure 15.1)
payoff
profit/loss
a.
call option,...
Refer to Figure 15.1, which lists the prices of various
Microsoft options. Use the data in the figure to calculate the
payoff and the profits for investments in each of the following
June 2017 expiration options, assuming that the stock price on the
expiration date is $71. (Leave no cells blank - be certain
to enter "0" wherever required. Loss amounts should be indicated by
a minus sign. Round "Profit/Loss"to 2 decimal places.)
(figure 15.1)
payoff
profit/loss
a.
call option,...
Refer to Figure 15.1, which lists the prices of various Microsoft options. Use the data in...
 Refer to Figure 15.1, which lists the prices of various Microsoft options. Use the data in the figure to calculate the payoff and the profit/loss for investments in each of the following July 2017 expiration options on a single share, assuming that the stock price on the expiration date is $84. (Leave no cells blank - be certain to enter "O" wherever required. Loss amounts should be indicated by a minus sign. Round "Profit/Loss" to 2 decimal places.) Payoff Profit/Loss...
Refer to Figure 15.1, which lists the prices of various Microsoft options. Use the data in the figure to calculate the p...
 Refer to Figure 15.1, which lists the prices of various
Microsoft options. Use the data in the figure to calculate the
payoff and the profits for investments in each of the following
June 2017 expiration options, assuming that the stock price on the
expiration date is $71.
Refer to Figure 15.1, which lists the prices of various Microsoft options. Use the data in the figure to calculate the payoff and the profits for investments in each of the following June...
Refer to Figure 15.1, which lists the prices of various
Microsoft options. Use the data in the figure to calculate the
payoff and the profits for investments in each of the following
June 2017 expiration options, assuming that the stock price on the
expiration date is $71.
Refer to Figure 15.1, which lists the prices of various Microsoft options. Use the data in the figure to calculate the payoff and the profits for investments in each of the following June...
Microsoft (MSFT) + IMSETI Underlying stock price = $71.75 Expiration Strike Call Put June 16, 2017...
 Microsoft (MSFT) + IMSETI Underlying stock price = $71.75 Expiration Strike Call Put June 16, 2017 70 2.02 0.24 June 16, 2017 72 0.67 0.90 June 16, 2017 74 0.132.37 70 July 7, 2017 July 7, 2017 July 7, 2017 72 2.400.58 1.15 1.32 0.42 2.59 74 Refer to Figure 15.1, which lists the prices of various Microsoft options. Use the data in the figure to calculate the payoff and the profit/loss for investments in each of the following July...
Refer to Eigure 15.1 which lists the prices of various Microsoft options Use the data in the figure to calculate the payoff and the proft/loss for investments in each of the following July...
 Refer to Eigure 15.1 which lists the prices of various Microsoft options Use the data in the figure to calculate the payoff and the proft/loss for investments in each of the following July 2017 expiration options on a single share, assuming that the stock price on the expiration date is S76 (Leave no cells blenk . be certain to enter-0-wherever required. Lon amount iheul be instated。,a minus sign. Round "Profit/Loss" to 2 decimal places Payoff Profit Loss Call optonX Put...
Graph the payoff of this portfolio at option expiration as a function of MICROSOFT’s stock price at that time.
 Use the Wall Street Journal listing below to answer this question.Consider the following options portfolio: You buy a July 2017 expiration call option on
MICROSOFT with exercise price $74. You also buy a July 2017 expiration MICROSOFT put
option with exercise price $72. Question: Graph the payoff of this portfolio at option expiration as a function of MICROSOFT’s
stock price at that time. (3 marks)
Use the Wall Street Journal listing below to answer this question.Consider the following options portfolio: You buy a July 2017 expiration call option on
MICROSOFT with exercise price $74. You also buy a July 2017 expiration MICROSOFT put
option with exercise price $72. Question: Graph the payoff of this portfolio at option expiration as a function of MICROSOFT’s
stock price at that time. (3 marks)
Use Figure 20.1, which lists prices of various IBM options. Use the data in the figure...
 Use Figure 20.1, which lists prices of various IBM options. Use the data in the figure to calculate the payoff and the profits for investments in each of the following July expiration options, assuming that the stock price on the expiration date is $150. (Do not round intermediate calculations. Round your answers to 2 decimal places. Leave no cells blank - be certain to enter "O" wherever required. Negative amounts should be indicated by a minus sign.) Payoff Profit/Loss a....
solve Use the data in the following table to calculate the payoff and the profits for...
 solve
Use the data in the following table to calculate the payoff and the profits for investments in each of the following July expiration options, assuming that the stock price on the expiration date is $150. PRICES AT CLOSE JUNE 30, 2016 IBM OM Underlying Stock Price 145.60 C Put Open Open Expiration Strike Last Volume Interest Last Volume Interest 15, 2016 1455.18 37 6319 79 5659 August 19, 2016 14569 512 2476 October 21, 2016 1453.42 80 1086 y...
solve
Use the data in the following table to calculate the payoff and the profits for investments in each of the following July expiration options, assuming that the stock price on the expiration date is $150. PRICES AT CLOSE JUNE 30, 2016 IBM OM Underlying Stock Price 145.60 C Put Open Open Expiration Strike Last Volume Interest Last Volume Interest 15, 2016 1455.18 37 6319 79 5659 August 19, 2016 14569 512 2476 October 21, 2016 1453.42 80 1086 y...
 Refer to Figure 15.1, which lists the prices of various
Microsoft options. Use the data in the figure to calculate the
payoff and the profit/loss for investments in each of the following
June 2017 expiration options on a single share, assuming that the
stock price on the expiration date is $82. (Leave no cells blank -
be certain to enter "0" wherever required. Loss amounts should be
indicated by a minus sign. Round "Profit/Loss" to 2 decimal
places.)
figure 15.1...
Refer to Figure 15.1, which lists the prices of various
Microsoft options. Use the data in the figure to calculate the
payoff and the profit/loss for investments in each of the following
June 2017 expiration options on a single share, assuming that the
stock price on the expiration date is $82. (Leave no cells blank -
be certain to enter "0" wherever required. Loss amounts should be
indicated by a minus sign. Round "Profit/Loss" to 2 decimal
places.)
figure 15.1...
 Refer to Figure 15.1, which lists the prices of various Microsoft options. Use the data in the figure to calculate the payoff and the profits for investments in each of the following June 2017 expiration options, assuming that the stock price on the expiration date is $71. (Leave no cells blank - be certain to enter "O" wherever required. Loss amounts should be indicated by a minus sign. Round "Profit/Loss"to 2 decimal places.) Payoff Profit/Loss a. Call option, X =...
 Refer to Figure 15.1, which lists the prices of various
Microsoft options. Use the data in the figure to calculate the
payoff and the profits for investments in each of the following
June 2017 expiration options, assuming that the stock price on the
expiration date is $71. (Leave no cells blank - be certain
to enter "0" wherever required. Loss amounts should be indicated by
a minus sign. Round "Profit/Loss"to 2 decimal places.)
(figure 15.1)
payoff
profit/loss
a.
call option,...
Refer to Figure 15.1, which lists the prices of various
Microsoft options. Use the data in the figure to calculate the
payoff and the profits for investments in each of the following
June 2017 expiration options, assuming that the stock price on the
expiration date is $71. (Leave no cells blank - be certain
to enter "0" wherever required. Loss amounts should be indicated by
a minus sign. Round "Profit/Loss"to 2 decimal places.)
(figure 15.1)
payoff
profit/loss
a.
call option,...
 Refer to Figure 15.1, which lists the prices of various Microsoft options. Use the data in the figure to calculate the payoff and the profit/loss for investments in each of the following July 2017 expiration options on a single share, assuming that the stock price on the expiration date is $84. (Leave no cells blank - be certain to enter "O" wherever required. Loss amounts should be indicated by a minus sign. Round "Profit/Loss" to 2 decimal places.) Payoff Profit/Loss...
 Refer to Figure 15.1, which lists the prices of various
Microsoft options. Use the data in the figure to calculate the
payoff and the profits for investments in each of the following
June 2017 expiration options, assuming that the stock price on the
expiration date is $71.
Refer to Figure 15.1, which lists the prices of various Microsoft options. Use the data in the figure to calculate the payoff and the profits for investments in each of the following June...
Refer to Figure 15.1, which lists the prices of various
Microsoft options. Use the data in the figure to calculate the
payoff and the profits for investments in each of the following
June 2017 expiration options, assuming that the stock price on the
expiration date is $71.
Refer to Figure 15.1, which lists the prices of various Microsoft options. Use the data in the figure to calculate the payoff and the profits for investments in each of the following June...
 Microsoft (MSFT) + IMSETI Underlying stock price = $71.75 Expiration Strike Call Put June 16, 2017 70 2.02 0.24 June 16, 2017 72 0.67 0.90 June 16, 2017 74 0.132.37 70 July 7, 2017 July 7, 2017 July 7, 2017 72 2.400.58 1.15 1.32 0.42 2.59 74 Refer to Figure 15.1, which lists the prices of various Microsoft options. Use the data in the figure to calculate the payoff and the profit/loss for investments in each of the following July...
 Refer to Eigure 15.1 which lists the prices of various Microsoft options Use the data in the figure to calculate the payoff and the proft/loss for investments in each of the following July 2017 expiration options on a single share, assuming that the stock price on the expiration date is S76 (Leave no cells blenk . be certain to enter-0-wherever required. Lon amount iheul be instated。,a minus sign. Round "Profit/Loss" to 2 decimal places Payoff Profit Loss Call optonX Put...
 Use Figure 20.1, which lists prices of various IBM options. Use the data in the figure to calculate the payoff and the profits for investments in each of the following July expiration options, assuming that the stock price on the expiration date is $150. (Do not round intermediate calculations. Round your answers to 2 decimal places. Leave no cells blank - be certain to enter "O" wherever required. Negative amounts should be indicated by a minus sign.) Payoff Profit/Loss a....
 solve
Use the data in the following table to calculate the payoff and the profits for investments in each of the following July expiration options, assuming that the stock price on the expiration date is $150. PRICES AT CLOSE JUNE 30, 2016 IBM OM Underlying Stock Price 145.60 C Put Open Open Expiration Strike Last Volume Interest Last Volume Interest 15, 2016 1455.18 37 6319 79 5659 August 19, 2016 14569 512 2476 October 21, 2016 1453.42 80 1086 y...
solve
Use the data in the following table to calculate the payoff and the profits for investments in each of the following July expiration options, assuming that the stock price on the expiration date is $150. PRICES AT CLOSE JUNE 30, 2016 IBM OM Underlying Stock Price 145.60 C Put Open Open Expiration Strike Last Volume Interest Last Volume Interest 15, 2016 1455.18 37 6319 79 5659 August 19, 2016 14569 512 2476 October 21, 2016 1453.42 80 1086 y...
Most questions answered within 3 hours.
-
What specific indicators can point to lack of progress for
African Americans in American society?
asked 16 minutes ago -
1-The Electrons in a beam are moving at 2.7×10⁸ m/s in an
electric field of 15000...
asked 32 minutes ago -
A gas tank is a vertical cylinder. It has a radius of 1m, a
height of...
asked 59 minutes ago -
Accent Software faces the following conditions. All of these
support Accent’s use of a market-penetration pricing...
asked 1 hour ago -
A mathematically inclined friend emails you the following
instructions: "Meet me in the cafeteria the first...
asked 1 hour ago -
A monopoly sells in two countries . The demand curves in the two
countries are p1...
asked 2 hours ago -
A .15kg rubber ball is bounced off a wall. Before hitting the
wall, the ball moves...
asked 3 hours ago -
A manufacturing company preparing to build a new plant is
considering three potential locations for it....
asked 3 hours ago -
B. If compound Y has approximately the same values of solubility
in toluene as compound X,...
asked 4 hours ago -
Oscar Inc. has inventory in Japan valued at 39,051,000 Yen one
year ago. One year ago...
asked 4 hours ago -
If Canada suffered from "fundamental disequilibrium," and its
government choose not to devalue its currency, a...
asked 4 hours ago -
4. How many input & output Key Value Pairs are passed into,
and emitted out of...
asked 4 hours ago