
Homework Answers

Add Answer to:
(1 point) The figure below shows the distribution of temperature, in degrees C, in a 5...
(1 point) The figure below shows the distribution of temperature, in degrees C, in a 5...
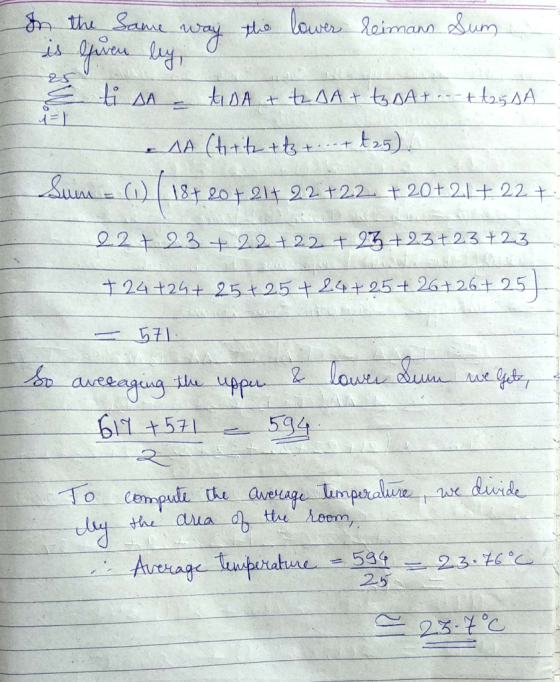
 (1 point) The figure below shows the distribution of temperature, in degrees C, in a 5 meter by 5 meter heated room. 19 28 21 22 23 24 25 26 27 28 Using Riemann sums, estimate the average temperature in the room. average temperature =26.768
(1 point) The figure below shows the distribution of temperature, in degrees C, in a 5 meter by 5 meter heated room. 19 28 21 22 23 24 25 26 27 28 Using Riemann sums,...
(1 point) The figure below shows the distribution of temperature, in degrees C, in a 5 meter by 5 meter heated room. 19 28 21 22 23 24 25 26 27 28 Using Riemann sums, estimate the average temperature in the room. average temperature =26.768
(1 point) The figure below shows the distribution of temperature, in degrees C, in a 5 meter by 5 meter heated room. 19 28 21 22 23 24 25 26 27 28 Using Riemann sums,...
What is a thermistor? (3pt.) A. B. What property of the thermistor changes with temperature? (2pt.) C. The figure shows temperature response measured by the thermistor. From the temperature vs time r...
 What is a thermistor? (3pt.) A. B. What property of the thermistor changes with temperature? (2pt.) C. The figure shows temperature response measured by the thermistor. From the temperature vs time response, compute the 10% to 90% rise time and the 10% to 90% fall time. (5pt) 32 31 30 29 O 28 27 26 Heat Released e 25 24 23 21 19 Heat Applied 18 10 15 20 25 30 35 40 45 50 55 6065 70 75 80...
Solve using Minitab. The table is observations on weekly operational downtime on a critical equipment (order...
 Solve using Minitab.
The table is observations on weekly operational downtime on a critical equipment (order read top to bottom and left to right). The target value for the mean is 25. (a) Estimate the process standard deviation. (b) Set up and apply a tabular cusum chart for this process using standardized values h 5 and k = 2. (c) Interpret the cusum chart - 27 24 22 27 25 27 23 20 28 29 24 28 20 29 21...
Solve using Minitab.
The table is observations on weekly operational downtime on a critical equipment (order read top to bottom and left to right). The target value for the mean is 25. (a) Estimate the process standard deviation. (b) Set up and apply a tabular cusum chart for this process using standardized values h 5 and k = 2. (c) Interpret the cusum chart - 27 24 22 27 25 27 23 20 28 29 24 28 20 29 21...
1 A measurement systems experiment involving 20 parts, three operators, and two measurements per ...
 1 A measurement systems experiment involving 20 parts, three operators, and two measurements per part is shown in Table 8E. 12. (a) Estimate the repeatability and reproducibility of the gauge (b) What is the estimate of total gauge variability? (c) If the product specifications are at LSL 6 and USIL - 60, what ca you say about gauge capa bility? TABLE 8E. 12 Measurement Data for Exercise 8.34 Operator 1 Operator 2 Operator 3 Measurements Measurements Measurements Part Number 1...
A soft drink manufacturer uses fire agents to handle premium distribution for is various products. The marketing director desired to study the timeliness with which the premiums are distributed. Twent...
A soft drink manufacturer uses fire agents to handle premium distribution for is various products. The marketing director desired to study the timeliness with which the premiums are distributed. Twenty transactions for each agent were selected at random and the time lapse (in days) for handling each transaction was determined. The results follow: Agent 1 Agent 2 Agent 3 Agent 4 Agent 5 24 18 10 15 33 24 20 11 13 22 29 20 8 18 28 20 24...
Question #5: A statistics teacher wants to see whether there is a statistically significant difference in...
 Question #5: A statistics teacher wants to see whether there is a statistically significant difference in the ages of day students and night students. A random sample of 31 students is selected from each group. The data are given below. Test the claim that there is difference in the mean ages of the two groups. Use a 0.01 Day Students: 22 24 24 23 19 19 23 22 18 21 21 18 18 25 29 24 23 22 22 21...
on 13 of 18> The Department of Energy provides fuel economy ratings for all cars and...
 on 13 of 18> The Department of Energy provides fuel economy ratings for all cars and light trucks sold in the United States. The table contains the estimated miles per gallon for city driving for the 186 cars classified as midsize in 2016, arranged in increasing order. 16 16 16 16 16 16 16 16 16 16 16 16 1617 17 17 17 17 18 18 1818 18 18 18 18 18 19 19 19 19 19 19 19 19...
Therefore, for this program you will read the data in the file named weatherdata_2.txt into arrays...
Therefore, for this program you will read the data in the file named weatherdata_2.txt into arrays for the wind speed and for the temperature. You will then use the stored data to calculate and output the average wind speed and the average temperature. Create a constant with a value of 30 and use that to declare and loop through your arrays and as a divisor to produce your averages. Here is the data file (below). 1. 14 25 2. 12...
In Matlab The arrays price A, price B and price C given below contain the price...
 In Matlab
The arrays price A, price B and price C given below contain the price in dollars of the three stocks over 10 days. price A = [19, 18, 22, 21, 25, 19, 17, 21, 27, 29] price B = [22, 17, 23, 24, 18, 16, 25, 28, 27, 27] price C = [10, 11, 12, 13, 19, 17, 20, 21, 24, 28] For the stock data, write a MATLAB code to plot the stock price vs. days graph...
In Matlab
The arrays price A, price B and price C given below contain the price in dollars of the three stocks over 10 days. price A = [19, 18, 22, 21, 25, 19, 17, 21, 27, 29] price B = [22, 17, 23, 24, 18, 16, 25, 28, 27, 27] price C = [10, 11, 12, 13, 19, 17, 20, 21, 24, 28] For the stock data, write a MATLAB code to plot the stock price vs. days graph...
I need help using python ( spyder) only use files , loops if needed is statement do not use , def...
 i need help using python ( spyder)
only use files , loops if needed
is statement
do not use , def function or any other.
Exercise 1: Daily temperature is recorded for some weeks in files (templ.txt", temp2.txt, and temp3.txt; provided in the MOODLE). The first line contains number of weeks and the rest of the lines each represent the week number followed by temperature on the seven days of that week (see samples input files below). Write a python...
i need help using python ( spyder)
only use files , loops if needed
is statement
do not use , def function or any other.
Exercise 1: Daily temperature is recorded for some weeks in files (templ.txt", temp2.txt, and temp3.txt; provided in the MOODLE). The first line contains number of weeks and the rest of the lines each represent the week number followed by temperature on the seven days of that week (see samples input files below). Write a python...
 (1 point) The figure below shows the distribution of temperature, in degrees C, in a 5 meter by 5 meter heated room. 19 28 21 22 23 24 25 26 27 28 Using Riemann sums, estimate the average temperature in the room. average temperature =26.768
(1 point) The figure below shows the distribution of temperature, in degrees C, in a 5 meter by 5 meter heated room. 19 28 21 22 23 24 25 26 27 28 Using Riemann sums,...
(1 point) The figure below shows the distribution of temperature, in degrees C, in a 5 meter by 5 meter heated room. 19 28 21 22 23 24 25 26 27 28 Using Riemann sums, estimate the average temperature in the room. average temperature =26.768
(1 point) The figure below shows the distribution of temperature, in degrees C, in a 5 meter by 5 meter heated room. 19 28 21 22 23 24 25 26 27 28 Using Riemann sums,...
 What is a thermistor? (3pt.) A. B. What property of the thermistor changes with temperature? (2pt.) C. The figure shows temperature response measured by the thermistor. From the temperature vs time response, compute the 10% to 90% rise time and the 10% to 90% fall time. (5pt) 32 31 30 29 O 28 27 26 Heat Released e 25 24 23 21 19 Heat Applied 18 10 15 20 25 30 35 40 45 50 55 6065 70 75 80...
 Solve using Minitab.
The table is observations on weekly operational downtime on a critical equipment (order read top to bottom and left to right). The target value for the mean is 25. (a) Estimate the process standard deviation. (b) Set up and apply a tabular cusum chart for this process using standardized values h 5 and k = 2. (c) Interpret the cusum chart - 27 24 22 27 25 27 23 20 28 29 24 28 20 29 21...
Solve using Minitab.
The table is observations on weekly operational downtime on a critical equipment (order read top to bottom and left to right). The target value for the mean is 25. (a) Estimate the process standard deviation. (b) Set up and apply a tabular cusum chart for this process using standardized values h 5 and k = 2. (c) Interpret the cusum chart - 27 24 22 27 25 27 23 20 28 29 24 28 20 29 21...
 1 A measurement systems experiment involving 20 parts, three operators, and two measurements per part is shown in Table 8E. 12. (a) Estimate the repeatability and reproducibility of the gauge (b) What is the estimate of total gauge variability? (c) If the product specifications are at LSL 6 and USIL - 60, what ca you say about gauge capa bility? TABLE 8E. 12 Measurement Data for Exercise 8.34 Operator 1 Operator 2 Operator 3 Measurements Measurements Measurements Part Number 1...
 Question #5: A statistics teacher wants to see whether there is a statistically significant difference in the ages of day students and night students. A random sample of 31 students is selected from each group. The data are given below. Test the claim that there is difference in the mean ages of the two groups. Use a 0.01 Day Students: 22 24 24 23 19 19 23 22 18 21 21 18 18 25 29 24 23 22 22 21...
 on 13 of 18> The Department of Energy provides fuel economy ratings for all cars and light trucks sold in the United States. The table contains the estimated miles per gallon for city driving for the 186 cars classified as midsize in 2016, arranged in increasing order. 16 16 16 16 16 16 16 16 16 16 16 16 1617 17 17 17 17 18 18 1818 18 18 18 18 18 19 19 19 19 19 19 19 19...
 In Matlab
The arrays price A, price B and price C given below contain the price in dollars of the three stocks over 10 days. price A = [19, 18, 22, 21, 25, 19, 17, 21, 27, 29] price B = [22, 17, 23, 24, 18, 16, 25, 28, 27, 27] price C = [10, 11, 12, 13, 19, 17, 20, 21, 24, 28] For the stock data, write a MATLAB code to plot the stock price vs. days graph...
In Matlab
The arrays price A, price B and price C given below contain the price in dollars of the three stocks over 10 days. price A = [19, 18, 22, 21, 25, 19, 17, 21, 27, 29] price B = [22, 17, 23, 24, 18, 16, 25, 28, 27, 27] price C = [10, 11, 12, 13, 19, 17, 20, 21, 24, 28] For the stock data, write a MATLAB code to plot the stock price vs. days graph...
 i need help using python ( spyder)
only use files , loops if needed
is statement
do not use , def function or any other.
Exercise 1: Daily temperature is recorded for some weeks in files (templ.txt", temp2.txt, and temp3.txt; provided in the MOODLE). The first line contains number of weeks and the rest of the lines each represent the week number followed by temperature on the seven days of that week (see samples input files below). Write a python...
i need help using python ( spyder)
only use files , loops if needed
is statement
do not use , def function or any other.
Exercise 1: Daily temperature is recorded for some weeks in files (templ.txt", temp2.txt, and temp3.txt; provided in the MOODLE). The first line contains number of weeks and the rest of the lines each represent the week number followed by temperature on the seven days of that week (see samples input files below). Write a python...
Most questions answered within 3 hours.
-
You currently have 20,000X ethidium bromide. You want to make
250 mL of 1X ethidium bromide...
asked 4 minutes ago -
What mass of lead is needed to absorb 348 J of heat if the temp
of...
asked 7 minutes ago -
Explain the difference between an auction with reserve
and an auction without reserve. if not specified,...
asked 9 minutes ago -
Write the net ionic equation for the precipitation reaction that
occurs when aqueous solutions of aluminum...
asked 12 minutes ago -
How do we find the slope distance, given the horizontal distance
and the zenith angle?
For...
asked 11 minutes ago -
The table to the right lists probabilities for the corresponding
numbers of girls in three births....
asked 22 minutes ago -
The inverse demand function for good X is P = 5−0.05Q. The
firm’s cost curve is...
asked 20 minutes ago -
The Fresh Connection is really pushing the new line of juice
products. Given that it takes...
asked 26 minutes ago -
An acute decrease in mean arterial pressure (by getting up very
quickly, for instance) will cause...
asked 25 minutes ago -
Is the pH of solutions important when using the Fluoride ISE? If
so, why?
asked 29 minutes ago -
Producer surplus is:
a.
always equal to consumer surplus.
b.
the amount paid to sellers above...
asked 30 minutes ago -
In 2005, Derrek Lee led the National Baseball League with a
0.335 batting average, meaning that...
asked 49 minutes ago