


Homework Answers


New equilibrium is where; Demand after tax = Supply
300 - (P + T) = 2P
300 - P - T = 2P
300 - T = 3P
P = (300 - T)/3
P = 100 - T/3
At Q = 200 - 2T/3, price at which this quantity intersects demand curve;
Qd = 300 - P
200 - 2T/3 = 300 - P
P = 300 - 200 + 2T/3
P = 100 + 2T/3
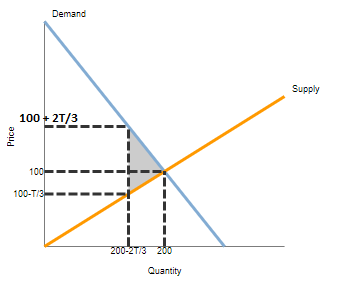
Base of triangle is [(100 + 2T/3) - (100 - T/3)] = 100 + 2T/3 - 100 + T/3 = T
Height is 200 - 200 + 2T/3 = 2T/3
DWL = 1/2 x base x height = 1/2 x T x 2T/3 = T2/3


The government could decrease dead-weight loss by reducing the tax.
The government could increase tax revenue by reducing the tax to $ 150.
a.

Because tax revenue is equal to and , you can compute tax revenue as a function of in the following way:
Plugging in tax values of $0, $30, $90, $150, $210, $270, and $300, yields a tax revenue of $0, $5,400, $12,600, $15,000, $12,600, $5,400, and $0 respectively. See Section: Deadweight Loss and Tax Revenue as Taxes Vary.
b.
Recall that the area of a triangle is .
According to this graph, the base of the deadweight loss triangle is , and the height is
.
c.

The area of the triangle that represents the deadweight loss is , where the base is the change in the price (which is the size of the tax) and the height is the amount of the decline in quantity (). Therefore, you can compute deadweight loss as a function of in the following way:
Plugging in tax values of $0, $90, $180, $240, and $300 yields deadweight losses of $0, $2,700, $10,800, $19,200, and $30,000, respectively. See Section: Deadweight Loss and Tax Revenue as Taxes Vary.
d.
The government now levies a tax on this good of $200 per unit.
Which of the following statements are true? Check all that apply.
Add Answer to:
We were unable to transcribe this imageWe were unable to transcribe this imageThe following graph shows...
Suppose that a market is described by the following supply and demaod equations: QD 240-P Suppose...
 Suppose that a market is described by the following supply and demaod equations: QD 240-P Suppose that a tax of T is placed on buyers, so the new demand equation is as follows: The new equilibrium price is now P 80, and the new equilibrium quantity is Q 160- Tax revenue is T x Q. Use the green points (triangle symbol) to graph tax revenue for the following tax (T) values: 0, 30, 90, 120, 150, 210, and 240. Laffer...
We were unable to transcribe this imageThe following graph shows the same market for socks, and...
 We were unable to transcribe this imageThe following graph shows the same market for socks, and the corresponding tax wedge. Use the green polygon (triangle symbol) to indicate the area that represents total spending by consumers after the government implements the tax. Then use the purple polygon (diamond symbol) to shade the area representing total revenue for producers in this case. Finally, use the tan polygon (dash symbol) to indicate the government tax revenue earned. After Tax Demand Total Spending...
schedule 1065: schedule k: k1: We were unable to transcribe this imageWe were unable to transcribe this imageWe were unable to transcribe this imageWe were unable to transcribe this im...
 schedule 1065:
schedule k:
k1:
We were unable to transcribe this imageWe were unable to transcribe this imageWe were unable to transcribe this imageWe were unable to transcribe this imageเว 1065 PG 1 Schedule K Schedule K1 U.S. Return of Partnership Income For calendar year 2018, or tax year beginning2018, ending20 Go to www.irs powForn 1065 for instructions and the lstest Information Form 1065 Department of the Treassury Intemal Revenue Service A Principal business actvity OMB No. 1545-0123 2018 D...
schedule 1065:
schedule k:
k1:
We were unable to transcribe this imageWe were unable to transcribe this imageWe were unable to transcribe this imageWe were unable to transcribe this imageเว 1065 PG 1 Schedule K Schedule K1 U.S. Return of Partnership Income For calendar year 2018, or tax year beginning2018, ending20 Go to www.irs powForn 1065 for instructions and the lstest Information Form 1065 Department of the Treassury Intemal Revenue Service A Principal business actvity OMB No. 1545-0123 2018 D...
We were unable to transcribe this imageThe following diagram shows the market demand for copper. Use...
 We were unable to transcribe this imageThe following diagram shows the market demand for copper. Use the orange points (square symbol) to plot the initial short-run Industry supply curve when there are 20 firms in the market. (Hint: You can disregard the portion of the supply curve that corresponds to prices where there is no output since this is the industry supply curve.) Next, use the purple points (diamond symbol) to plot the short-run industry supply curve when there are...
Macroeconomics economics
Suppose that a market is described by the following supply and demand equations:QS = 2PQD = 300 – Pa. Solve for the equilibrium price and the equilibrium quantity.b. Suppose that a tax of T is placed on buyers, so the new demand equation isQD = 300 – (P + T).Solve for the new equilibrium. What happens to the price received by sellers, the price paid by buyers, and the quantity sold? c. Tax revenue is T X Q. Use your answer...
We were unable to transcribe this imageNow, assume that one of the hot dog stands successfully lobbies the city council to obtain the exclusive right to sell hot dogs within the city limits. This fir...
 We were unable to transcribe this imageNow, assume that one of the hot dog stands successfully lobbies the city council to obtain the exclusive right to sell hot dogs within the city limits. This firm buys up all the rest of the hot dog stands in the city and operates as a monopoly. Assume that this change doesn't affect demand and that the new monopoly's marginal cost curve corresponds exactly to the supply curve on the previous graph. Under this...
2. Taxes and welfare Consider the market for mountain bikes. The following graph shows the demand...
 2. Taxes and welfare Consider the market for mountain bikes. The following graph shows the demand and supply for mountain bikes before the government imposes any taxes. First, use the black point (plus symbol) to indicate the equilibrium price and quantity of mountain bikes in the absence of a tax. Then use the green point (triangle symbol) to shade the area representing total consumer surplus (CS) at the equilibrium price. Next, use the purple point (diamond symbol) to shade the...
Homework (Ch 08) 3. Relationship between tax revenues, deadweight loss, and demandelasticity The government is considering...
 Homework (Ch 08) 3. Relationship between tax revenues, deadweight loss, and demandelasticity The government is considering levying a tax of $60 per unit on suppliers of either concert tickets or bus passes. The supply curve for each of these two goods is identical, as you can see on each of the following graphs. The demand for concert tickets is shown by Dc (on the first graph), and the demand for bus passes is shown by Ds (on the second graph)....
Consider the market for mountain bikes. The following graph shows the demand and supply for mountain...
 Consider the market for mountain bikes. The following graph shows the demand and supply for mountain bikes before the government imposes any taxes First, use the black point (plus symbol) to indicate the equilibrium price and quantity of mountain bikes in the absence of a tax. Then use the green point (triangle symbol) to shade the area representing total consumer surplus (CS) at the equilibrium price. Next, use the purple point (diamond symbol) to shade the area representing total producer...
in this case it should tax (concert tickets, bus passes) With a relatively (less, more) 3....
 in
this case it should tax (concert tickets, bus passes)
With a relatively (less, more)
3. Relationship between tax revenues, deadweight loss, and demand elasticity The government is considering levying a tax of $60 per unit on suppliers of either concert tickets or bus passes. The supply curve for each of these two goods is identical, as you can see on each of the following graphs. The demand for concert tickets is shown by Dc (on the first graph), and...
in
this case it should tax (concert tickets, bus passes)
With a relatively (less, more)
3. Relationship between tax revenues, deadweight loss, and demand elasticity The government is considering levying a tax of $60 per unit on suppliers of either concert tickets or bus passes. The supply curve for each of these two goods is identical, as you can see on each of the following graphs. The demand for concert tickets is shown by Dc (on the first graph), and...
 Suppose that a market is described by the following supply and demaod equations: QD 240-P Suppose that a tax of T is placed on buyers, so the new demand equation is as follows: The new equilibrium price is now P 80, and the new equilibrium quantity is Q 160- Tax revenue is T x Q. Use the green points (triangle symbol) to graph tax revenue for the following tax (T) values: 0, 30, 90, 120, 150, 210, and 240. Laffer...
 We were unable to transcribe this imageThe following graph shows the same market for socks, and the corresponding tax wedge. Use the green polygon (triangle symbol) to indicate the area that represents total spending by consumers after the government implements the tax. Then use the purple polygon (diamond symbol) to shade the area representing total revenue for producers in this case. Finally, use the tan polygon (dash symbol) to indicate the government tax revenue earned. After Tax Demand Total Spending...
 schedule 1065:
schedule k:
k1:
We were unable to transcribe this imageWe were unable to transcribe this imageWe were unable to transcribe this imageWe were unable to transcribe this imageเว 1065 PG 1 Schedule K Schedule K1 U.S. Return of Partnership Income For calendar year 2018, or tax year beginning2018, ending20 Go to www.irs powForn 1065 for instructions and the lstest Information Form 1065 Department of the Treassury Intemal Revenue Service A Principal business actvity OMB No. 1545-0123 2018 D...
schedule 1065:
schedule k:
k1:
We were unable to transcribe this imageWe were unable to transcribe this imageWe were unable to transcribe this imageWe were unable to transcribe this imageเว 1065 PG 1 Schedule K Schedule K1 U.S. Return of Partnership Income For calendar year 2018, or tax year beginning2018, ending20 Go to www.irs powForn 1065 for instructions and the lstest Information Form 1065 Department of the Treassury Intemal Revenue Service A Principal business actvity OMB No. 1545-0123 2018 D...
 We were unable to transcribe this imageThe following diagram shows the market demand for copper. Use the orange points (square symbol) to plot the initial short-run Industry supply curve when there are 20 firms in the market. (Hint: You can disregard the portion of the supply curve that corresponds to prices where there is no output since this is the industry supply curve.) Next, use the purple points (diamond symbol) to plot the short-run industry supply curve when there are...
 We were unable to transcribe this imageNow, assume that one of the hot dog stands successfully lobbies the city council to obtain the exclusive right to sell hot dogs within the city limits. This firm buys up all the rest of the hot dog stands in the city and operates as a monopoly. Assume that this change doesn't affect demand and that the new monopoly's marginal cost curve corresponds exactly to the supply curve on the previous graph. Under this...
 2. Taxes and welfare Consider the market for mountain bikes. The following graph shows the demand and supply for mountain bikes before the government imposes any taxes. First, use the black point (plus symbol) to indicate the equilibrium price and quantity of mountain bikes in the absence of a tax. Then use the green point (triangle symbol) to shade the area representing total consumer surplus (CS) at the equilibrium price. Next, use the purple point (diamond symbol) to shade the...
 Homework (Ch 08) 3. Relationship between tax revenues, deadweight loss, and demandelasticity The government is considering levying a tax of $60 per unit on suppliers of either concert tickets or bus passes. The supply curve for each of these two goods is identical, as you can see on each of the following graphs. The demand for concert tickets is shown by Dc (on the first graph), and the demand for bus passes is shown by Ds (on the second graph)....
 Consider the market for mountain bikes. The following graph shows the demand and supply for mountain bikes before the government imposes any taxes First, use the black point (plus symbol) to indicate the equilibrium price and quantity of mountain bikes in the absence of a tax. Then use the green point (triangle symbol) to shade the area representing total consumer surplus (CS) at the equilibrium price. Next, use the purple point (diamond symbol) to shade the area representing total producer...
 in
this case it should tax (concert tickets, bus passes)
With a relatively (less, more)
3. Relationship between tax revenues, deadweight loss, and demand elasticity The government is considering levying a tax of $60 per unit on suppliers of either concert tickets or bus passes. The supply curve for each of these two goods is identical, as you can see on each of the following graphs. The demand for concert tickets is shown by Dc (on the first graph), and...
in
this case it should tax (concert tickets, bus passes)
With a relatively (less, more)
3. Relationship between tax revenues, deadweight loss, and demand elasticity The government is considering levying a tax of $60 per unit on suppliers of either concert tickets or bus passes. The supply curve for each of these two goods is identical, as you can see on each of the following graphs. The demand for concert tickets is shown by Dc (on the first graph), and...
Most questions answered within 3 hours.
-
> Women’s pulse rates are normally distributed with a mean of
68.5 beats per minute and...
asked 11 seconds from now -
Briefly describe an aspect of the strengths perspective that is
consistent with your own understanding of...
asked 1 minute ago -
Step by step method of using Sparse Identification of Nonlinear
Dynamics (SINDy) to model your own...
asked 9 minutes ago -
3) What are the typical social structures in a global city?
asked 3 hours ago -
Luther Corporation
Consolidated Balance Sheet
December 31, 2019 and 2018 (in $ millions)
Assets
2019
2018...
asked 3 hours ago -
(Expected rate of return and risk) Carter Inc. is evaluating a
security. Calculate the investment’s expected...
asked 5 hours ago -
What specific indicators can point to lack of progress for
African Americans in American society?
asked 6 hours ago -
1-The Electrons in a beam are moving at 2.7×10⁸ m/s in an
electric field of 15000...
asked 7 hours ago -
A gas tank is a vertical cylinder. It has a radius of 1m, a
height of...
asked 7 hours ago -
Accent Software faces the following conditions. All of these
support Accent’s use of a market-penetration pricing...
asked 8 hours ago -
A mathematically inclined friend emails you the following
instructions: "Meet me in the cafeteria the first...
asked 8 hours ago -
A monopoly sells in two countries . The demand curves in the two
countries are p1...
asked 9 hours ago