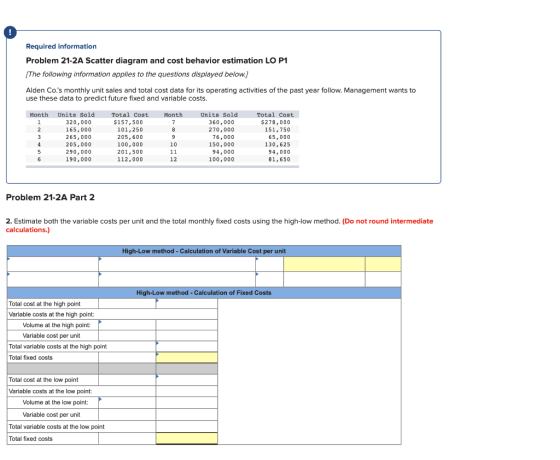
Problem 21-2A Scatter diagram and cost behavior estimation LO P1
Alden Co.'s monthly unit sales and total cost data for its operating activities of the past year follow. Management wants to use these data to predict future fixed and variable costs.
$$ \begin{array}{cccccc} \text { Month } & \text { Units Sold } & \text { Total Cost } & \text { Month } & \text { Units Sold } & \text { Total Cost } \\ 1 & 320,000 & \$ 157,500 & 7 & 360,000 & \$ 278,000 \\ 2 & 165,000 & 101,250 & 8 & 270,000 & 151,750 \\ 3 & 265,000 & 205,600 & 9 & 76,000 & 65,000 \\ 4 & 205,000 & 100,000 & 10 & 150,000 & 130,625 \\ 5 & 290,000 & 201,500 & 11 & 94,000 & 94,000 \\ 6 & 190,000 & 112,000 & 12 & 100,000 & 81,650 \end{array} $$
2. Estimate both the variable costs per unit and the total monthly fixed costs using the high-low method. (Do not round intermediate calculations.)
3. Predict future total costs when sales volume is (a) 390,000 units and (b) 430,000 units.
Homework Answers
| High Low method-Calculation of variable cost per unit | ||||
| Change in cost | Cost at high point minus cost at low point | 213000 | Variable cost per unit | 0.75 |
| Change in volume | Volume at high point minus volume at low point | 284000 | ||
| High Low method-Calculation of fixed costs | ||||
| Total cost at the high point | 278000 | |||
| Variable costs at the high point: | ||||
| Volume at the high point | 360000 | |||
| Variable cost per unit | 0.75 | |||
| Total Variable costs at the high point | 270000 | |||
| Total fixed costs | 8000 | |||
| Total cost at the low point | 65000 | |||
| Variable costs at the low point: | ||||
| Volume at the low point | 76000 | |||
| Variable cost per unit | 0.75 | |||
| Total Variable costs at the low point | 57000 | |||
| Total fixed costs | 8000 | |||
3
| Predictions | ||
| Sales(units) | 390000 | 430000 |
| Variable costs | 292500 | 322500 |
| Fixed costs | 8000 | 8000 |
| Total costs | 300500 | 330500 |
| Workings: | ||
| Predictions | ||
| Sales(units) | 390000 | 430000 |
| Variable costs | =390000*0.75 | =430000*0.75 |
Add Answer to:
Required information Problem 21-2A Scatter diagram and cost behavior estimation LO P1 (The following information applies...
Required information Problem 21-2A Cost behavior estimation LO P1 [The following information applies to the questions...
 Required information Problem 21-2A Cost behavior estimation LO P1 [The following information applies to the questions displayed below.] Alden Co.'s monthly unit sales and total cost data for its operating activities of the past year follow. Management wants to use these data to predict future fixed and variable costs. Month 1 2 3 4 5 6 Units Sold 323,500 168,500 268,500 208,500 293,500 193,500 Total Cost $ 161,000 104,750 209,100 103,500 205,000 115,500 Month 7 8 9 10 11 12...
Required information The following information applies to the questions displayed below. Alden Co.'s monthly unit sales...
 Required information The following information applies to the questions displayed below. Alden Co.'s monthly unit sales and total cost data for its operating activities of the past year follow. Management wants to use these data to predict future fixed and variable costs. Month Month Ол шын Units Sold 323,500 168,500 268,500 208,500 293,500 193,500 Total Cost $161,000 104,750 209,100 103,500 205,000 115,500 Units Sold 356,500 273,500 75,300 153,500 97,500 103,500 Total Cost $ 252,716 155,250 61,500 134,125 97,500 78,150 3....
Exercise 21-6 Cost behavior estimation-scatter diagram and high-low LO P1 Felix & Co. reports the following...
 Exercise 21-6 Cost behavior estimation-scatter diagram and high-low LO P1 Felix & Co. reports the following information about its units produced and total costs. Units Produced Period 1 2 3 4 5 410 810 1,210 1,610 Total Costs $2,510 3,110 3,710 4,310 4,910 Period 6 7 8 9 Units Produced 2,010 2,410 2,810 3,210 3,610 Total Costs $5,510 6,110 6,710 7,310 8,286 LO Estimate total costs if 3,010 units are produced. Complete the below table to calculate the fixed cost...
Not sure how to do future predictions Required information [The following information applies to the questions...
 Not sure how to do future predictions
Required information [The following information applies to the questions displayed below.) Alden Co.'s monthly unit sales and total cost data for its operating activities of the past year follow. Management wants to use these data to predict future fixed and variable costs. Month 1 2 3 4 5 6 Units Sold 317,500 162,500 262,500 202,500 287,500 187,500 Total Cost $155,000 98,750 203, 100 97,500 199,000 109,500 Month 7 8 9 10 Units Sold...
Not sure how to do future predictions
Required information [The following information applies to the questions displayed below.) Alden Co.'s monthly unit sales and total cost data for its operating activities of the past year follow. Management wants to use these data to predict future fixed and variable costs. Month 1 2 3 4 5 6 Units Sold 317,500 162,500 262,500 202,500 287,500 187,500 Total Cost $155,000 98,750 203, 100 97,500 199,000 109,500 Month 7 8 9 10 Units Sold...
Required information [The following information applies to the questions displayed below.) Alden Co.'s monthly unit sales...
 Required information [The following information applies to the questions displayed below.) Alden Co.'s monthly unit sales and total cost data for its operating activities of the past year follow. Management wants to use these data to predict future fixed and variable costs. Month Month Home Units Sold 323,500 168,500 268,500 208,500 293,500 193,500 Total Cost $161,000 104,750 209,100 103,500 205,000 115,500 Units Sold 356,500 273,500 75,300 153,500 97,500 103,500 Total Cost $252,716 155, 250 61,500 134, 125 97,500 78,150 10...
Required information [The following information applies to the questions displayed below.] Part 1 of 4 Alden...
 Required information [The following information applies to the questions displayed below.] Part 1 of 4 Alden Co.'s monthly unit sales and total cost data for its operating activities of the past year follow. Management wants to use these data to predict future fixed and variable costs. points Month Month eBook ол еш мн Units Sold 323,500 168,500 268,500 208,500 293,500 193,500 Total Cost $161,000 104,750 209,100 103,500 205,000 115,500 Units Sold 356,500 273,500 75,300 153,500 97,500 103,500 Total Cost $...
Alden Co.’s monthly unit sales and total cost data for its operating activities of the past...
Alden Co.’s monthly unit sales and total cost data for its operating activities of the past year follow. Management wants to use these data to predict future fixed and variable costs. Month Units Sold Total Cost Month Units Sold Total Cost 1 320,000 $ 160,000 7 340,000 $ 220,000 2 160,000 100,000 8 280,000 160,000 3 280,000 220,000 9 80,000 64,000 4 200,000 100,000 10 160,000 140,000 5 300,000 230,000 11 100,000 100,000 6 200,000 120,000 12 110,000 80,000...
Exercise 18-6 Cost behavior estimation-scatter diagram and high-low LO P1 Felix & Co. reports the following...
 Exercise 18-6 Cost behavior estimation-scatter diagram and high-low LO P1 Felix & Co. reports the following information about its units produced and total costs. Units Units Period Period Produced Produced Total Costs Total Costs $2,630 3,230 3,830 4,430 5,030 2,130 2,530 2,930 3,330 3,730 $5,630 6,230 6,830 7,430 8,598 1 0 6 2 530 7 3 930 8 1,330 1,730 4 5 10 Estimate total costs if 3,130 units are produced. Complete the below table to calculate the fixed cost...
Exercise 18-6 Cost behavior estimation-scatter diagram and high-low LO P1 Felix & Co. reports the following...
 Exercise 18-6 Cost behavior estimation-scatter diagram and high-low LO P1 Felix & Co. reports the following Information about its units produced and total costs. points Units Produced Period Period Total Costs $2,700 3,300 3,980 4.500 608 1.ece 1.489 1.800 Units Produced 2,200 2.680 3.898 3,480 3,888 Total Costs $5.799 6,300 6,988 7.500 9. 160 eBook 5.100 le Hint Estimate total costs of 3.200 units are produced. Complete the below table to calculate the fixed cost and variable cost of sales...
 Required information Problem 21-2A Cost behavior estimation LO P1 [The following information applies to the questions displayed below.] Alden Co.'s monthly unit sales and total cost data for its operating activities of the past year follow. Management wants to use these data to predict future fixed and variable costs. Month 1 2 3 4 5 6 Units Sold 323,500 168,500 268,500 208,500 293,500 193,500 Total Cost $ 161,000 104,750 209,100 103,500 205,000 115,500 Month 7 8 9 10 11 12...
 Required information The following information applies to the questions displayed below. Alden Co.'s monthly unit sales and total cost data for its operating activities of the past year follow. Management wants to use these data to predict future fixed and variable costs. Month Month Ол шын Units Sold 323,500 168,500 268,500 208,500 293,500 193,500 Total Cost $161,000 104,750 209,100 103,500 205,000 115,500 Units Sold 356,500 273,500 75,300 153,500 97,500 103,500 Total Cost $ 252,716 155,250 61,500 134,125 97,500 78,150 3....
 Required information The following information applies to the questions displayed below. Alden Co.'s monthly unit sales and total cost data for its operating activities of the past year follow. Management wants to use these data to predict future fixed and variable costs. Month Month Ол шын Units Sold 323,500 168,500 268,500 208,500 293,500 193,500 Total Cost $161,000 104,750 209,100 103,500 205,000 115,500 Units Sold 356,500 273,500 75,300 153,500 97,500 103,500 Total Cost $ 252,716 155,250 61,500 134,125 97,500 78,150 3....
 Exercise 21-6 Cost behavior estimation-scatter diagram and high-low LO P1 Felix & Co. reports the following information about its units produced and total costs. Units Produced Period 1 2 3 4 5 410 810 1,210 1,610 Total Costs $2,510 3,110 3,710 4,310 4,910 Period 6 7 8 9 Units Produced 2,010 2,410 2,810 3,210 3,610 Total Costs $5,510 6,110 6,710 7,310 8,286 LO Estimate total costs if 3,010 units are produced. Complete the below table to calculate the fixed cost...
 Not sure how to do future predictions
Required information [The following information applies to the questions displayed below.) Alden Co.'s monthly unit sales and total cost data for its operating activities of the past year follow. Management wants to use these data to predict future fixed and variable costs. Month 1 2 3 4 5 6 Units Sold 317,500 162,500 262,500 202,500 287,500 187,500 Total Cost $155,000 98,750 203, 100 97,500 199,000 109,500 Month 7 8 9 10 Units Sold...
Not sure how to do future predictions
Required information [The following information applies to the questions displayed below.) Alden Co.'s monthly unit sales and total cost data for its operating activities of the past year follow. Management wants to use these data to predict future fixed and variable costs. Month 1 2 3 4 5 6 Units Sold 317,500 162,500 262,500 202,500 287,500 187,500 Total Cost $155,000 98,750 203, 100 97,500 199,000 109,500 Month 7 8 9 10 Units Sold...
 Required information [The following information applies to the questions displayed below.) Alden Co.'s monthly unit sales and total cost data for its operating activities of the past year follow. Management wants to use these data to predict future fixed and variable costs. Month Month Home Units Sold 323,500 168,500 268,500 208,500 293,500 193,500 Total Cost $161,000 104,750 209,100 103,500 205,000 115,500 Units Sold 356,500 273,500 75,300 153,500 97,500 103,500 Total Cost $252,716 155, 250 61,500 134, 125 97,500 78,150 10...
 Required information [The following information applies to the questions displayed below.] Part 1 of 4 Alden Co.'s monthly unit sales and total cost data for its operating activities of the past year follow. Management wants to use these data to predict future fixed and variable costs. points Month Month eBook ол еш мн Units Sold 323,500 168,500 268,500 208,500 293,500 193,500 Total Cost $161,000 104,750 209,100 103,500 205,000 115,500 Units Sold 356,500 273,500 75,300 153,500 97,500 103,500 Total Cost $...
 Exercise 18-6 Cost behavior estimation-scatter diagram and high-low LO P1 Felix & Co. reports the following information about its units produced and total costs. Units Units Period Period Produced Produced Total Costs Total Costs $2,630 3,230 3,830 4,430 5,030 2,130 2,530 2,930 3,330 3,730 $5,630 6,230 6,830 7,430 8,598 1 0 6 2 530 7 3 930 8 1,330 1,730 4 5 10 Estimate total costs if 3,130 units are produced. Complete the below table to calculate the fixed cost...
 Exercise 18-6 Cost behavior estimation-scatter diagram and high-low LO P1 Felix & Co. reports the following Information about its units produced and total costs. points Units Produced Period Period Total Costs $2,700 3,300 3,980 4.500 608 1.ece 1.489 1.800 Units Produced 2,200 2.680 3.898 3,480 3,888 Total Costs $5.799 6,300 6,988 7.500 9. 160 eBook 5.100 le Hint Estimate total costs of 3.200 units are produced. Complete the below table to calculate the fixed cost and variable cost of sales...
Most questions answered within 3 hours.
-
Please explain steps:
An 80 kg swimmer steps off a platform 10 m above the water...
asked 19 minutes ago -
A lottery exists where balls numbered 1 to 17 are placed in an
urn. To win,...
asked 22 minutes ago -
26) Briefly describe, using words or simple diagrams, the
chemiosmotic theory for coupling oxidation to phosphorylation...
asked 2 hours ago -
Suppose that XX is a random variable with mean 16 and standard
deviation 5 . Also...
asked 3 hours ago -
Calculate the number density of argon gas at a temperature of
24C and a pressure of...
asked 6 hours ago -
Alternative
Classification
How to Estimate
Probabilities from Data? ( For continuous Attributes)
And How to generate...
asked 6 hours ago -
An explosion breaks a 20.0-kg object into three parts. The
object is initially moving at a...
asked 7 hours ago -
Calculate the approximate number of residues of Rubisco, which
is involved in carbon fixation in plants,...
asked 8 hours ago -
Other decisions about scientific claims can have a much broader
impact.ENERGYarrow-10x10.png, environment, health, security - all...
asked 9 hours ago -
I need to write a research paper and work cited about this
topic: The United States...
asked 9 hours ago -
Hello! I was wondering if I could have some help?
If the vapor pressure of carvone...
asked 9 hours ago -
An economist wants to estimate the mean per capita income (in
thousands of dollars) for a...
asked 10 hours ago