Problem Set 1: Pearson Correlation Coefficient Analysis Research Scenario: A clinical psychologist would like to determine...
Problem Set 1: Pearson Correlation Coefficient Analysis
Research Scenario: A clinical psychologist would like to determine whether there is a relationship between observer ratings of children’s externalizing behaviors and scores on an established diagnostic interview assessing externalizing disorders (like ADHD, CD, etc.). He administers the diagnostic interview to 25 children and records these scores. He then trains an observer to independently rate carefully-defined externalizing behaviors for each of the 25 children. These scores are totaled for an overall “externalizing behavior index.” On both the interview and the behavioral ratings, a higher score indicates higher levels of externalizing behavior. These scores are listed in the table below.
Using this table, enter the data into a new SPSS data file and run a Pearson correlation coefficient analysis to test whether there is a relationship between the interview scores and the behavior ratings in this sample. Create a scatterplot to show the relationship between the variables.
|
Interview (Range 0 to 9) |
Externalizing Behavior Index (Range 0 to 25) |
|
3 |
7 |
|
2 |
9 |
|
4 |
6 |
|
9 |
22 |
|
7 |
20 |
|
6 |
12 |
|
4 |
10 |
|
8 |
9 |
|
3 |
5 |
|
4 |
7 |
|
2 |
5 |
|
1 |
3 |
|
6 |
16 |
|
8 |
19 |
|
7 |
21 |
|
7 |
22 |
|
1 |
4 |
|
2 |
7 |
|
3 |
7 |
|
3 |
3 |
|
5 |
13 |
|
8 |
19 |
|
7 |
16 |
|
4 |
12 |
|
3 |
9 |
- Paste SPSS output.
- Write an APA-style Results section based on your analysis. Include your scatterplot as an APA-style figure as demonstrated in the APA writing presentation. This part is so important here! PLEASE write this section in apa, scientific format! Thank you!
Homework Answers
spss procedure
- enter the data
- go to analysy then to correlate and then choose bivariate
- send the variable into variables panel and click ok
- now go to graphs then click legacy dialogs and then scatter/dots;
- choose simple scatter and the click define
- send interview into x-axis panel and externalising behaviour index into y-axis and then click ok
- double click on the graph and choose fitted line and close the dailogue box opened
 output1
![Correlations [DataSet0] Correlations Externalizingb ehaviourindex Interview Interview Pearson Correlation 1 864 Sig. (2-taile](http://img.homeworklib.com/images/27bd5731-acad-452f-b80f-acaad7d63884.png?x-oss-process=image/resize,w_560)
output2
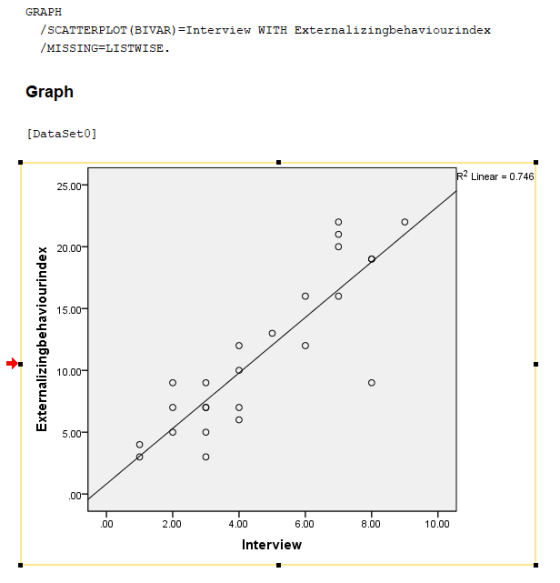
results
the Spearman correlation between interview and externalising index is 0.864
this indicates that there is a fairly positive correlation between interview and externalising index variables
this can be clearly seen from the graph that there is a linear association between the two variables
Add Answer to:
Problem Set 1: Pearson Correlation Coefficient Analysis Research Scenario: A clinical psychologist would like to determine...
Problem Set 2: Pearson Correlation Coefficient Analysis Research Scenario: A social worker involved in suicide prevention...
Problem Set 2: Pearson Correlation Coefficient Analysis Research Scenario: A social worker involved in suicide prevention efforts wants to study the relationship between social isolation and possible suicide risk. She collects scores from a sample of 13 patients on two measures: one is a measure of social isolation on which higher scores indicate higher isolation (possible range of scores = 0- 20), and the other is the Suicide Risk Scale (SRS, Plutchik et al., 1989), on which higher scores indicate...
Problem Set 1: Linear Regression Analysis Research Scenario: A community psychologist is interested in whether people’s...
Problem Set 1: Linear Regression Analysis Research Scenario: A community psychologist is interested in whether people’s self-reported degree of religious belief predicts their self-reported feelings of well-being. She administers two questionnaires to 17 individuals, one of which measures degree of religious beliefs (scores range from 1-20 with higher scores indicating higher degree of belief), and another which measures feelings of well-being (scores range from 1-25 with higher scores indicating stronger feelings of well-being). The psychologist compiles the information listed in...
SPSS: Correlation Use SPSS or Excel to calculate the appropriate correlation coefficient for the following data...
SPSS: Correlation Use SPSS or Excel to calculate the appropriate correlation coefficient for the following data for “Hours of Exercise” and “Life Satisfaction.” (0 = Not at all satisfied). Provide an APA-style results section write – up. (b) Graph the relationship. HINT: Below you will find instructions for the APA-style write-up. Complete the write-up on a word document and upload the file for submission. Hours of Exercise Life Satisfaction 2 6 0 2 5 13 6 15 1 3 2...
Problem Set 2: Research Scenario: In a clinic that focuses on helping victims of domestic minor...
 Problem Set 2: Research Scenario: In a clinic that focuses on helping victims of domestic minor sex trafficking (DMST), a team of social workers wants to compare the differential effects of treatments for complex trauma. They divide 21 participants into three groups (n = 7 each) that do not differ significantly from one another in terms of pre-treatment trauma symptomology. One group receives Trauma-Focused Cognitive-Behavioral Therapy (TFCBT), one receives Experiential Group Therapy (EGT), and one receives a combination of the...
Problem Set 1: Chi Square Test of Goodness of Fit Research Scenario: A political psychologist is curious about the effects of a town hall meeting on people’s intentions to support a state proposit...
Problem Set 1: Chi Square Test of Goodness of Fit Research Scenario: A political psychologist is curious about the effects of a town hall meeting on people’s intentions to support a state proposition that would legalize gambling. He interviews people as they leave and asks them whether their opinion about the proposition has changed as a result of the meeting. He records these frequencies in the table below. Using this table, enter the data into a new SPSS data file...
Determine the Pearson product-moment correlation coefficient for the following data. x 1 10 9 6 4...
Determine the Pearson product-moment correlation coefficient for the following data. x 1 10 9 6 4 3 2 y 9 4 4 5 7 7 10 (Do not round the intermediate values. Round your answer to 3 decimal places.) Correlation coefficient, r
Determine the Pearson product-moment correlation coefficient for the following data. x 1 12 9 7 4...
Determine the Pearson product-moment correlation coefficient for the following data. x 1 12 9 7 4 3 2 y 8 4 6 5 7 7 9
Erika Diaz Your name Assignment 10 Correlation, Scatterplot, and Prediction (due 7/30/20 - 1/4/20)(28 pts) 1....
 Erika Diaz Your name Assignment 10 Correlation, Scatterplot, and Prediction (due 7/30/20 - 1/4/20)(28 pts) 1. A teacher hypothesizes that the more days of school student misses, the worse the student will do on a final exam (possible scores on the exam range from 0 to 20). She obtained a random sample of 12 students. The data are shown below. Student days missed Final exam score 1 3 16 2 2 17 3 5 13 4 8 7 5 4...
Problem Set 1: The One-way ANOVA Research Scenario: Depressed patients are randomly assigned to 1 of 3 therapists. At th...
Problem Set 1: The One-way ANOVA Research Scenario: Depressed patients are randomly assigned to 1 of 3 therapists. At the end of 3 months, each patient completes a standardized test of depression (higher scores indicate higher level of depression). The patients’ scores are shown below. Analyze the data to determine how effective these 3 therapists are at treating depression (assume that before the treatment, all 3 groups of patients had the same average depression score). Using this table, enter the...
Compute the Pearson Correlation Coefficient, r, for the following data X Y 1 7 3 4...
Compute the Pearson Correlation Coefficient, r, for the following data X Y 1 7 3 4 5 3 4 2 2 4 Note: If it is a decimal number with two or more than two places, leave only two decimal places after the decimal point and do not round. If it is a negative correlation, please do not forget to include the negative sign. 1a) The Pearson Correlation, r is: 1b) The correlation is Group of answer choices a) Medium...
 Problem Set 2: Research Scenario: In a clinic that focuses on helping victims of domestic minor sex trafficking (DMST), a team of social workers wants to compare the differential effects of treatments for complex trauma. They divide 21 participants into three groups (n = 7 each) that do not differ significantly from one another in terms of pre-treatment trauma symptomology. One group receives Trauma-Focused Cognitive-Behavioral Therapy (TFCBT), one receives Experiential Group Therapy (EGT), and one receives a combination of the...
 Erika Diaz Your name Assignment 10 Correlation, Scatterplot, and Prediction (due 7/30/20 - 1/4/20)(28 pts) 1. A teacher hypothesizes that the more days of school student misses, the worse the student will do on a final exam (possible scores on the exam range from 0 to 20). She obtained a random sample of 12 students. The data are shown below. Student days missed Final exam score 1 3 16 2 2 17 3 5 13 4 8 7 5 4...
Most questions answered within 3 hours.
-
The average length of time between arrivals at a turnpike
toll-booth is 26 seconds. What is...
asked 1 hour ago -
(a) A piston at 6.1 atm contains a gas that occupies a volume of
3.5 L....
asked 2 hours ago -
Please answer true or false. Words
cannot be changed or added in to make it true...
asked 2 hours ago -
An empty test tube weighs 15.923 grams. Then,
MgCl2•6H2O is added into the test tube. After...
asked 2 hours ago -
Assume memory access is 10 units of time and disk access is
10000 units of time....
asked 3 hours ago -
1. Are all good samples random?
2. Magazines often report surveys giving statistics such as “63%...
asked 3 hours ago -
Under all the various types of market structures, firms
must eventually earn some economic profits for...
asked 3 hours ago -
Consider the following fitness regime for a single locus trait
with two co-dominant alleles: w11 =...
asked 3 hours ago -
A large cable company reports the following.
80% of its customers subscribe to its cable TV...
asked 3 hours ago -
Please answer the question in brief.
Discuss the role of ERP in organizations. Are ERP tools...
asked 3 hours ago -
Discuss the pros and cons of collaborative software such
as SameTime. Does it increase productivity? What...
asked 3 hours ago -
Buying your in-laws a gift because it’s expected is
due to the ____________ motive of gift-giving....
asked 3 hours ago