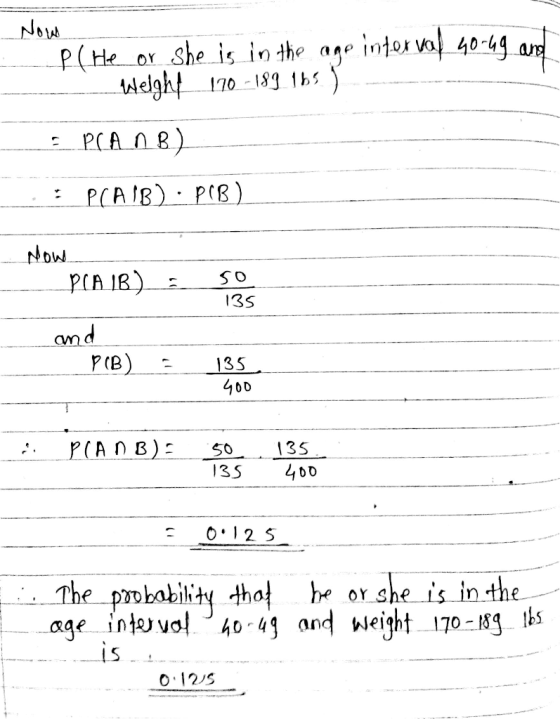
Using the table, find for a randomly selected individual from this population the probability that he or she:
Is in the age interval 40-49 and weighs 170-189 lbs

Homework Answers

Add Answer to:
Using the table, find for a randomly selected individual from this population the probability that he...
The following data are the weights (lbs) of 20 college-age males. 140, 155, 153, 150, 178,...
 The following data are the weights (lbs) of 20 college-age
males.
140, 155, 153, 150, 178, 160, 155, 145, 163, 150
141, 169, 179, 176, 157, 153, 184, 160, 145, 185
3).2pts. Can you expect you
weigh less than about 50% of the 20 college-age males if you are
165 lbs? why?
4).2pts. What kind of weight (or weight range) should you keep
if you want to be in the lower 25%?
a. The following data are the weights (lbs)...
The following data are the weights (lbs) of 20 college-age
males.
140, 155, 153, 150, 178, 160, 155, 145, 163, 150
141, 169, 179, 176, 157, 153, 184, 160, 145, 185
3).2pts. Can you expect you
weigh less than about 50% of the 20 college-age males if you are
165 lbs? why?
4).2pts. What kind of weight (or weight range) should you keep
if you want to be in the lower 25%?
a. The following data are the weights (lbs)...
b. approximate the population mean and standard deviation u= o= c. which gender has a higher...
 b. approximate the population mean and standard
deviation
u=
o=
c. which gender has a higher mean age?
d. which gender has the higher dispersion in age?
please help
3.3.13 Male and female populations of elephants under 80 years old are represented by age in the table below Complete parts (a) through (d) (a) Approximate the population mean and standard deviation of age for males 41.33 (Round to two decimal places as needed.) Age Females Males (Round to two decimal...
b. approximate the population mean and standard
deviation
u=
o=
c. which gender has a higher mean age?
d. which gender has the higher dispersion in age?
please help
3.3.13 Male and female populations of elephants under 80 years old are represented by age in the table below Complete parts (a) through (d) (a) Approximate the population mean and standard deviation of age for males 41.33 (Round to two decimal places as needed.) Age Females Males (Round to two decimal...
i keep trying to solve it but keep getting these two wrong. would love some help,...
 i keep trying to solve it but keep getting these two wrong. would
love some help, thank you
Approximate the mean of the frequency distribution for the ages of the residents of a town. The approximate mean age is (Round to one decimal place as needed.) years. Age Frequency D 0-9 34 10-19 23 20-29 15 30-39 24 40-49 21 50-59 45 60-69 48 70-79 17 80-89 4 Approximate the mean of the frequency distribution for the ages of the...
i keep trying to solve it but keep getting these two wrong. would
love some help, thank you
Approximate the mean of the frequency distribution for the ages of the residents of a town. The approximate mean age is (Round to one decimal place as needed.) years. Age Frequency D 0-9 34 10-19 23 20-29 15 30-39 24 40-49 21 50-59 45 60-69 48 70-79 17 80-89 4 Approximate the mean of the frequency distribution for the ages of the...
In Exercises 29–32, find the mean of the data summarized in the frequency distribution. Also, compare...
 In Exercises 29–32, find the mean of the data summarized in the frequency distribution. Also, compare the computed means to the actual means obtained by using the original list of data values, which are as follows: (Exercise 29) 36.2 years; (Exercise 30) 44.1 years; (Exercise 31) 224.3: (Exercise 32) 255.1. 30. 29. Frequency Age (yr) of Best Actress When Oscar Was Won 20-29 28 30-39 Frequency 29 34 14 3 5 Age (yr) of Best Actor When Oscar Was Won...
4. The following table lists the number of unicyclists in Corvallis, OR. by age group. Age...
4. The following table lists the number of unicyclists in Corvallis, OR. by age group. Age Group Frequency ≤19 72 20-29 20 30-39 3 40-49 27 50-59 70 60-69 100 ≥70 80 What is the probability that a randomly selected unicyclist from Corvallis, OR. is not between 50 and 59?
The frequency distribution listed in the table represents the number of drivers in fatal crashes in...
The frequency distribution listed in the table represents the number of drivers in fatal crashes in 2005 by age, by sex. Age Male Female 20-29 10,387 3,318 30-39 8,216 2,794 40-49 7,910 2,651 50-59 5,360 1,792 60-69 2,837 1,014 70-79 1,920 938 80-84 744 372 A) Determine the approximate mean age of males and females involved in traffic fatalities. (Two separate answers- one for males and one for females) B) How do you think an insurance company might use the...
(a) Approx. Kate the population mean and standard deviation of age for males. Male and female...
 (a) Approx. Kate the population mean and standard deviation of age for males. Male and female populations of elephants under 80 years old are represented by age in the table below. Complete parts (a) through (d) UE (Round to two decimal places as needed.) A (Round to two decimal places as needed.) (b) Approximate the population mean and standard deviation of age for females. Age -9 10-19 20-29 30-39 10-49 50-59 50-69 70-79 Males 14 13 12 17 24 24...
1.20 Table 1.9 give the age distribution of the U.S. population in 1890 and 2010 (projected): A) What age class contained the median age in 1890? B) What age class contained the median age in 2010? C...
 1.20 Table 1.9 give the age distribution of the U.S. population
in 1890 and 2010 (projected):
A) What age class contained the median age in 1890?
B) What age class contained the median age in 2010?
C) compare the median ages and comment on the change in age
distributions
.22 The Los Angeles Times ofsep contains the following statement: "According to Table 1.9 U.S. Population in 1890 and 2010 (projected) 30-39 40-49 50-59 9.5% 14.2% 60-69 4% 9.5% 70+ Age...
1.20 Table 1.9 give the age distribution of the U.S. population
in 1890 and 2010 (projected):
A) What age class contained the median age in 1890?
B) What age class contained the median age in 2010?
C) compare the median ages and comment on the change in age
distributions
.22 The Los Angeles Times ofsep contains the following statement: "According to Table 1.9 U.S. Population in 1890 and 2010 (projected) 30-39 40-49 50-59 9.5% 14.2% 60-69 4% 9.5% 70+ Age...
Homework Assignment Regarding Probability Addition Rule The following table summarizes results from a study of people...
Homework Assignment Regarding Probability Addition Rule The following table summarizes results from a study of people who refused to answer survey questions. Age Group 18-21 22-29 30-39 40-49 50-59 60 and over Responded 73 255 245 136 138 202 Refused 11 20 33 16 27 49 What is the probability that the selected person refused to answer or is in the 40-49 age bracket? What is the probability that the selected person responded or is in the 18-21 age bracket?...
5. This problem is about the population of New York City. Given below is a joint-probability...
 5. This problem is about the population of New York City. Given below is a joint-probability distribution of NYC based on results from the 2010 Census. Age Under 10 years old 10-19 years old 20-29 years old 30-39 years old 40-49 years old 50-59 years old 60-69 years old 70-79 years old 80 and over Male 0.063 0.069 0.077 0.076 0.072 0.057 0.035 0.018 0.010 Female 0.060 0.067 0.079 0.080 0.077 0.066 0.046 0.028 Y 0.020 Write the answers to...
 The following data are the weights (lbs) of 20 college-age
males.
140, 155, 153, 150, 178, 160, 155, 145, 163, 150
141, 169, 179, 176, 157, 153, 184, 160, 145, 185
3).2pts. Can you expect you
weigh less than about 50% of the 20 college-age males if you are
165 lbs? why?
4).2pts. What kind of weight (or weight range) should you keep
if you want to be in the lower 25%?
a. The following data are the weights (lbs)...
The following data are the weights (lbs) of 20 college-age
males.
140, 155, 153, 150, 178, 160, 155, 145, 163, 150
141, 169, 179, 176, 157, 153, 184, 160, 145, 185
3).2pts. Can you expect you
weigh less than about 50% of the 20 college-age males if you are
165 lbs? why?
4).2pts. What kind of weight (or weight range) should you keep
if you want to be in the lower 25%?
a. The following data are the weights (lbs)...
 b. approximate the population mean and standard
deviation
u=
o=
c. which gender has a higher mean age?
d. which gender has the higher dispersion in age?
please help
3.3.13 Male and female populations of elephants under 80 years old are represented by age in the table below Complete parts (a) through (d) (a) Approximate the population mean and standard deviation of age for males 41.33 (Round to two decimal places as needed.) Age Females Males (Round to two decimal...
b. approximate the population mean and standard
deviation
u=
o=
c. which gender has a higher mean age?
d. which gender has the higher dispersion in age?
please help
3.3.13 Male and female populations of elephants under 80 years old are represented by age in the table below Complete parts (a) through (d) (a) Approximate the population mean and standard deviation of age for males 41.33 (Round to two decimal places as needed.) Age Females Males (Round to two decimal...
 i keep trying to solve it but keep getting these two wrong. would
love some help, thank you
Approximate the mean of the frequency distribution for the ages of the residents of a town. The approximate mean age is (Round to one decimal place as needed.) years. Age Frequency D 0-9 34 10-19 23 20-29 15 30-39 24 40-49 21 50-59 45 60-69 48 70-79 17 80-89 4 Approximate the mean of the frequency distribution for the ages of the...
i keep trying to solve it but keep getting these two wrong. would
love some help, thank you
Approximate the mean of the frequency distribution for the ages of the residents of a town. The approximate mean age is (Round to one decimal place as needed.) years. Age Frequency D 0-9 34 10-19 23 20-29 15 30-39 24 40-49 21 50-59 45 60-69 48 70-79 17 80-89 4 Approximate the mean of the frequency distribution for the ages of the...
 In Exercises 29–32, find the mean of the data summarized in the frequency distribution. Also, compare the computed means to the actual means obtained by using the original list of data values, which are as follows: (Exercise 29) 36.2 years; (Exercise 30) 44.1 years; (Exercise 31) 224.3: (Exercise 32) 255.1. 30. 29. Frequency Age (yr) of Best Actress When Oscar Was Won 20-29 28 30-39 Frequency 29 34 14 3 5 Age (yr) of Best Actor When Oscar Was Won...
 (a) Approx. Kate the population mean and standard deviation of age for males. Male and female populations of elephants under 80 years old are represented by age in the table below. Complete parts (a) through (d) UE (Round to two decimal places as needed.) A (Round to two decimal places as needed.) (b) Approximate the population mean and standard deviation of age for females. Age -9 10-19 20-29 30-39 10-49 50-59 50-69 70-79 Males 14 13 12 17 24 24...
 1.20 Table 1.9 give the age distribution of the U.S. population
in 1890 and 2010 (projected):
A) What age class contained the median age in 1890?
B) What age class contained the median age in 2010?
C) compare the median ages and comment on the change in age
distributions
.22 The Los Angeles Times ofsep contains the following statement: "According to Table 1.9 U.S. Population in 1890 and 2010 (projected) 30-39 40-49 50-59 9.5% 14.2% 60-69 4% 9.5% 70+ Age...
1.20 Table 1.9 give the age distribution of the U.S. population
in 1890 and 2010 (projected):
A) What age class contained the median age in 1890?
B) What age class contained the median age in 2010?
C) compare the median ages and comment on the change in age
distributions
.22 The Los Angeles Times ofsep contains the following statement: "According to Table 1.9 U.S. Population in 1890 and 2010 (projected) 30-39 40-49 50-59 9.5% 14.2% 60-69 4% 9.5% 70+ Age...
 5. This problem is about the population of New York City. Given below is a joint-probability distribution of NYC based on results from the 2010 Census. Age Under 10 years old 10-19 years old 20-29 years old 30-39 years old 40-49 years old 50-59 years old 60-69 years old 70-79 years old 80 and over Male 0.063 0.069 0.077 0.076 0.072 0.057 0.035 0.018 0.010 Female 0.060 0.067 0.079 0.080 0.077 0.066 0.046 0.028 Y 0.020 Write the answers to...
Most questions answered within 3 hours.
-
Explain traveling wave theory. Explain how the peaking of the
wave leads to action potentials and...
asked 8 minutes ago -
If you mixed 35.0 mLmL of 0.100 M Tris-HCl with 65.0
mLmL of 0.200 M Tris-base, what would...
asked 5 minutes ago -
Which force do you think wields a stronger influence over our
ethical behavior – our personal...
asked 10 minutes ago -
11.1 In the northeast
regions of the United States and in eastern Canada, many people
heat their...
asked 9 minutes ago -
What is the entropy change to the surroundings when 1 mol of ice
melts in someone's...
asked 11 minutes ago -
Are adult gamers less likely to use a gaming console (Xbox,
PlayStation, Wii, etc...) than teen...
asked 16 minutes ago -
Pt1
An electrochemical cell is set up at 25°C based on the overall
reaction represented by...
asked 17 minutes ago -
Bruin, Inc., has identified the following two mutually
exclusive projects:
Year
Cash Flow (A)
Cash...
asked 19 minutes ago -
A mutual fund salesperson has arranged to call on four people
tomorrow. Based on past experience...
asked 22 minutes ago -
The decomposition of SO2Cl2 is first order
and has a rate constant of + 2.90 x...
asked 45 minutes ago -
A solid, frictionless cylindrical reel of mass M=5.00kg and
radius R=0.55m is used to draw water...
asked 1 hour ago -
The work done by the spring's restoring force
on the free end of a spring while...
asked 39 minutes ago