Create a Control Limit chart for the following: You are a manager at RadioTag Inc., a...
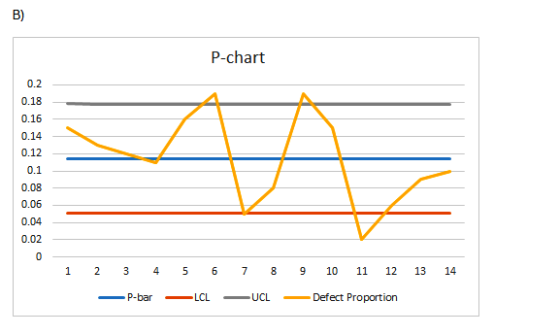
Create a Control Limit chart for the following: You are a manager at RadioTag Inc., a maker of RFID tags for US military and private use (e.g., Wal Mart). Your process assembles radio id tags to certain specifications – 95.5 confidence intervals, however as they come off the assembly line a test is run on each tag to determine whether the frequency works or does not (hint the data are dichotomous distributed binary). Below are the data you collected over a 2-week period: GRAPH GOES UNDER THIS
Day sample size non-working tags
1 100 15
2 100 13
3 100 12
4 100 11
5 100 16
6 100 19
7 100 5
8 100 8
9 100 19
10 100 15
11 100 2
12 100 6
13 100 9
14 100 10
- P bar =
SD of P bar =
UCLP Bar =
LCLP bar =
B) Graph and Plot the data. Round answers to three places.
Clearly identify the P bar, s.d. of Pbar, UCL, LCL (make sure the graph elements are labeled) and identified in A above.
C) Compare p value to a. What is the result?
Homework Answers


Add Answer to:
Create a Control Limit chart for the following: You are a manager at RadioTag Inc., a...
SPC MODELING Create a Control Limit chart for the following: You are a manager at RadioTag Inc.,...
SPC MODELING Create a Control Limit chart for the following: You are a manager at RadioTag Inc., a maker of RFID tags for US military and private use (e.g., Wal Mart). Your process assembles radio id tags to certain specifications – 95.5 confidence intervals, however as they come off the assembly line a test is run on each tag to determine whether the frequency works or does not (hint the data are dichotomous distributed binary). Below are the data you collected over a...
Refer to the table Factors for Computing Control Chart Limits (3 sigma) for this problem. Pet...
 Refer to the table Factors for Computing Control Chart Limits (3 sigma) for this problem. Pet Products, Inc., caters to the growing market for cat supplies, with a full line of products ranging from litter to toys to flea powder. One of its newer products, a tube of fluid that prevents hairballs in long-haired cats, is produced by an automated machine set to fill each tube with 63 5 grams of paste To keep this filling process under control, four...
How to find the mean and standard deviations from the below control chart and calculate defect...
How to find the mean and standard deviations from the below control chart and calculate defect rate Subgroup 1 2 3 4 5 6 7 8 9 10 11 12 13 14 15 16 17 18 19 20 21 22 23 24 1 3.757 3.753 3.744 3.755 3.757 3.741 3.746 3.746 3.760 3.741 3.749 3.746 3.743 3.755 3.745 3.748 3.757 3.740 3.756 3.742 3.752 3.746 3.745 3.752 2 3.749 3.739 3.745 3.753 3.760 3.749 3.743 3.753 3.755 3.745 3.751 3.749...
Do the following problems: The following are quality control data for a manufacturing process at ...
Do the following problems: The following are quality control data for a manufacturing process at Kensprt Chemical Company. The data show the temperature in degrees centigrade at five points in time during the manufacturing cycle. The company is interested in using quality control charts in monitoring the temperature of its manufacturing cycle. Construct an X bar and R chart and indicate what its tells you about the process. Sample X bar R 1 95.72 1.0 2 95.24 .9 3 95.38 ...
You need not run Python programs on a computer in solving the following problems. Place your...
 You need not run Python programs on a computer in solving the following problems. Place your answers into separate "text" files using the names indicated on each problem. Please create your text files using the same text editor that you use for your .py files. Answer submitted in another file format such as .doc, .pages, .rtf, or.pdf will lose least one point per problem! [1] 3 points Use file math.txt What is the precise output from the following code? bar...
 Refer to the table Factors for Computing Control Chart Limits (3 sigma) for this problem. Pet Products, Inc., caters to the growing market for cat supplies, with a full line of products ranging from litter to toys to flea powder. One of its newer products, a tube of fluid that prevents hairballs in long-haired cats, is produced by an automated machine set to fill each tube with 63 5 grams of paste To keep this filling process under control, four...
 You need not run Python programs on a computer in solving the following problems. Place your answers into separate "text" files using the names indicated on each problem. Please create your text files using the same text editor that you use for your .py files. Answer submitted in another file format such as .doc, .pages, .rtf, or.pdf will lose least one point per problem! [1] 3 points Use file math.txt What is the precise output from the following code? bar...
Most questions answered within 3 hours.
-
Suppose X follows an exponential distribution with mean 7.5.
Determine the conditional probability P(x > 2.5...
asked 11 minutes ago -
Young softball batters are often instructed to “choke-up on the
bat” by their coach. In terms...
asked 14 minutes ago -
Suppose that you are an official with Mexico's economic
development agency. Write a one-page memo detailing...
asked 45 minutes ago -
If you were an international firm, why would you support the
concept of global free trade?...
asked 1 hour ago -
Cisco packet tracer
Q1) Do you get any changes of IP address when packet is
traversing...
asked 1 hour ago -
What is the pressure inside a 33.0 L container holding 106.4 kg
of argon gas at...
asked 2 hours ago -
Question no 2
A housekeeping support department budgets its costs at
SR 40,000 per month plus...
asked 2 hours ago -
A 1400Kg sports car accelerates from rest to 90km/h in 7.0s.
What is the average power...
asked 3 hours ago -
For the following reaction, 0.128 moles of
potassium hydrogen sulfateare mixed with
0.504 moles of potassium...
asked 6 hours ago -
1. What is the present value of $400, three years in the future
if the interest...
asked 7 hours ago -
The labor force minus the number of employed equals the number
of unemployed.
a. True
b....
asked 9 hours ago -
Determine the mass in units of grams [g] of 0.49 moles [mol]
of a new fictitious...
asked 9 hours ago