 [MATLAB Scriptfile task]
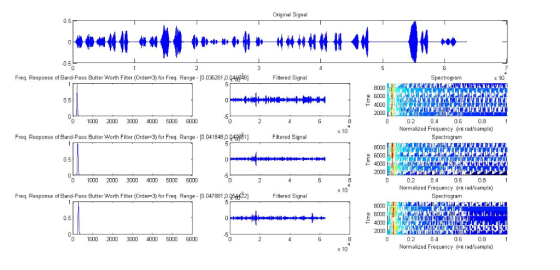
Design N-band tone vocoder with a given figure (below) in MATLAB implementing the given script file(bands_cutoff). This program should be able to process any sound(.wav) file. Then, graph the band-passed signals and amplitude envelopes extracted(after rectification and low-pass filtering) and waveforms of the original sound and vocoded sound. Additionally, using the output of the script file, make spectrograms of the original sound and the synthesized sound.
Homework Answers
close all,
clear all,
clc,
ProjectPath = pwd;
SoundPath = strcat(ProjectPath,'\BirdChirp.wav');
FilterOrder=3;
No_of_Bands=3;
fmin = 200;
fmax = 300;
[y, Fs, nbits] = wavread(SoundPath);
Freq = (bands_cutoff(fmin,fmax,No_of_Bands))/(Fs/2);
L=length(Freq);
subplot(4,3,[1 2 3]); plot(y); title('Original Signal');
c=4;
for r=1:L-1
[b a] = butter(FilterOrder,[Freq(r) Freq(r+1)],'bandpass');
[H F] = freqz(b,a,256,Fs);
FilteredSignal = filter(b,a,y);
subplot(4,3,c); plot(F,abs(H));
str = strcat('Freq. Response of Band-Pass Butter Worth Filter
(Order=',num2str(FilterOrder),') for Freq. Range -
[',num2str(Freq(r)),', ',num2str(Freq(r+1)),']') ;
title(str);
subplot(4,3,c+1); plot(FilteredSignal); title('Filtered
Signal');
subplot(4,3,c+2); spectrogram(FilteredSignal);
title('Spectrogram');
c=c+3;
end
Add Answer to:
[MATLAB Scriptfile task]
Design N-band tone vocoder with a given figure (below) in MATLAB
implementing the...
[MATLAB Scriptfile task] Design N-band tone vocoder with a given figure (below) in MATLAB implementing the...
 [MATLAB Scriptfile task]
Design N-band tone vocoder with a given figure (below) in MATLAB
implementing the given script file(bands_cutoff). This program
should be able to process any sound(.wav) file. Then, graph the
band-passed signals and amplitude envelopes extracted(after
rectification and low-pass filtering) and waveforms of the original
sound and vocoded sound. Additionally, using the output of the
script file, make spectrograms of the original sound and the
synthesized sound.
Bandpass filter Modulation Band-limiting Envelope detection BPF RECT LPF BPF sine...
[MATLAB Scriptfile task]
Design N-band tone vocoder with a given figure (below) in MATLAB
implementing the given script file(bands_cutoff). This program
should be able to process any sound(.wav) file. Then, graph the
band-passed signals and amplitude envelopes extracted(after
rectification and low-pass filtering) and waveforms of the original
sound and vocoded sound. Additionally, using the output of the
script file, make spectrograms of the original sound and the
synthesized sound.
Bandpass filter Modulation Band-limiting Envelope detection BPF RECT LPF BPF sine...
LMS project Using the notes discussed in class: Implementing the LMS Algorithm First generate some signals clear all c...
 LMS project Using the notes discussed in class: Implementing the LMS Algorithm First generate some signals clear all close al1: Generate signals for testing the LMS Algorithm 1000 Fs Sampling frequency Sample time 1/Fs 10000: = L Length of signal S Time vector (0:L-1) *T ; Sum of a 50 Hz sinusoid and a 120 Hz sinusoid 0.7 sin (2*pi*50*t); inuside X d+ 10 randn (size (t)); Sinusoids 5O0000000L plus noise fiqure (1) plot (Fs*t (1:150),x (1:1500)) title('Signal Corrupted with...
LMS project Using the notes discussed in class: Implementing the LMS Algorithm First generate some signals...
 LMS project Using the notes discussed in class: Implementing the LMS Algorithm First generate some signals clear all close al1: Generate signals for testing the LMS Algorithm 1000 Fs Sampling frequency Sample time 1/Fs 10000: = L Length of signal S Time vector (0:L-1) *T ; Sum of a 50 Hz sinusoid and a 120 Hz sinusoid 0.7 sin (2*pi*50*t); inuside X d+ 10 randn (size (t)); Sinusoids 5O0000000L plus noise fiqure (1) plot (Fs*t (1:150),x (1:1500)) title('Signal Corrupted with...
 [MATLAB Scriptfile task]
Design N-band tone vocoder with a given figure (below) in MATLAB
implementing the given script file(bands_cutoff). This program
should be able to process any sound(.wav) file. Then, graph the
band-passed signals and amplitude envelopes extracted(after
rectification and low-pass filtering) and waveforms of the original
sound and vocoded sound. Additionally, using the output of the
script file, make spectrograms of the original sound and the
synthesized sound.
Bandpass filter Modulation Band-limiting Envelope detection BPF RECT LPF BPF sine...
[MATLAB Scriptfile task]
Design N-band tone vocoder with a given figure (below) in MATLAB
implementing the given script file(bands_cutoff). This program
should be able to process any sound(.wav) file. Then, graph the
band-passed signals and amplitude envelopes extracted(after
rectification and low-pass filtering) and waveforms of the original
sound and vocoded sound. Additionally, using the output of the
script file, make spectrograms of the original sound and the
synthesized sound.
Bandpass filter Modulation Band-limiting Envelope detection BPF RECT LPF BPF sine...
 LMS project Using the notes discussed in class: Implementing the LMS Algorithm First generate some signals clear all close al1: Generate signals for testing the LMS Algorithm 1000 Fs Sampling frequency Sample time 1/Fs 10000: = L Length of signal S Time vector (0:L-1) *T ; Sum of a 50 Hz sinusoid and a 120 Hz sinusoid 0.7 sin (2*pi*50*t); inuside X d+ 10 randn (size (t)); Sinusoids 5O0000000L plus noise fiqure (1) plot (Fs*t (1:150),x (1:1500)) title('Signal Corrupted with...
 LMS project Using the notes discussed in class: Implementing the LMS Algorithm First generate some signals clear all close al1: Generate signals for testing the LMS Algorithm 1000 Fs Sampling frequency Sample time 1/Fs 10000: = L Length of signal S Time vector (0:L-1) *T ; Sum of a 50 Hz sinusoid and a 120 Hz sinusoid 0.7 sin (2*pi*50*t); inuside X d+ 10 randn (size (t)); Sinusoids 5O0000000L plus noise fiqure (1) plot (Fs*t (1:150),x (1:1500)) title('Signal Corrupted with...
Most questions answered within 3 hours.
-
Question#4
Given the following 14 compounds: acetic acid ammonia sodium
chloride carbon dioxide water perchloric acid...
asked 16 minutes ago -
Antimony, Sb, has two stable isotopes: 121Sb, 120.904u, and
123Sb, 122.904u. What is the percent abundance...
asked 27 minutes ago -
Compare the solubility of calcium fluoride in
each of the following aqueous solutions:
Clear All
0.10...
asked 22 minutes ago -
The annual maintenance costs associated with a machine are $1000
for the first 10 years and...
asked 26 minutes ago -
Milano Pizza is a small neighborhood pizzeria that has a small
area for in-store dining as...
asked 43 minutes ago -
Suppose the current exchange rate for the Russian ruble is RUB
64.18. The expected exchange rate...
asked 43 minutes ago -
Instructions Part 1 - Implementation of a Doubly Linked
List Attached you will find the code...
asked 2 hours ago -
You work for a factory making bricks. A coworker accidentally
contaminated one of the bricks with...
asked 2 hours ago -
for python-3
I want to prompt the user to enter their first name and then
Call...
asked 3 hours ago -
Q3 If the formation of a hairpin loop requires a minimum
stem
length of 6 contiguous...
asked 3 hours ago -
Enzymes work by lowering the _____ of a reaction.
Select one:
a. activation energy
b. entropy...
asked 4 hours ago -
Assume three digits are used to represent positive integers and
also assume the following operations are...
asked 4 hours ago