consider a labor market experiment involving four buyers (firms) and four sellers (workers). Each firm seeks...
consider a labor market experiment involving four buyers (firms) and four sellers (workers).
Each firm seeks to hire a single worker and each worker can work for a single firm. Each firm has a maximum revenue they can earn per worker hired.
Each worker has a cost of working, which represents the value of his or her leisure time. Suppose the revenues from hiring a worker are $23, $15 and $21 and $17 for firms 1, 2, 3 and 4, respectively. Suppose the costs to working of the four workers are $12, $14, $16 and $10.
a. What would be the equilibrium wage range and employment level (number of workers hired)you would predict for this experiment? Illustrate your argument graphically.
b.Suppose you were interested in studying the effect of the introduction of a $20 minimum wage in your experimental labor market. What would you predict would be the equilibrium wage and employment level in this case?
c.How might your results rationalize the economics profession’s view that a minimum wage “creates both winners and losers”.
Homework Answers
a).
Consider the following fig.
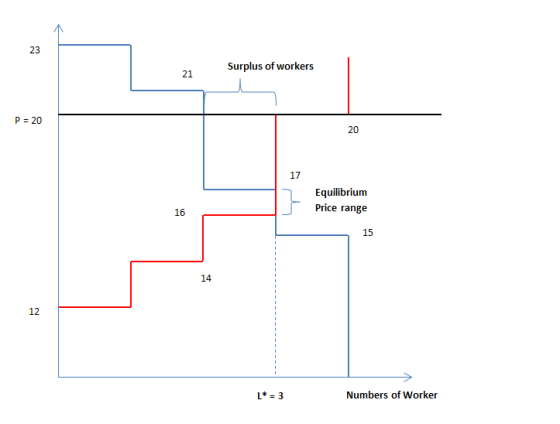
So, here blue curve be the demand curve for worker and the red curve be the supply curve, => the intersection of these two will be the equilibrium price, => here the range of equilibrium price is “16 to 17” and the equilibrium labor employment is “L*=3”.
b).
Now, if a minimum wage of “p=20” is imposed, => it will be a binding price floor, => here supply increase to “4” and the demand decreases to “2”, => there will be an excess supply or surplus of worker. So, the price will be “p=20” and the employment decreases to “L=2 < 3”.
c).
Here we can see that the firm’s surplus decreases (the area under the demand curve over the price level) and the workers surplus (the area under the supply curve under the price level) increases, => here the workers are the winner and the firms are the losers.
Add Answer to:
consider a labor market experiment involving four buyers (firms)
and four sellers (workers).
Each firm seeks...
A construction firm builds using two types of labor. The first is more skilled union workers,...
 A construction firm builds using two types of labor. The first is more skilled union workers, and the second is lesser skilled non-union workers. 8. a Would you expect the equilibrium wage to be the same or different of each type of worker. Briefly explain b) On separate graphs, show the equilibrium wage and employment for each type of worker Part of the compensation for union workers consists of health care benefits. These benefits cost the firm S1 per hour....
Problem 3 - Labor Market & Taxes PROBLEM 3: LABOR MARKET AND TAXES (20 POINTS) Suppose...
 Problem 3 - Labor Market & Taxes
PROBLEM 3: LABOR MARKET AND TAXES (20 POINTS) Suppose a worker has preferences over consumption and leisure that can be repre- sented by the following utility function: U = ln (C) + In (1) There are 16 hours per day available for leisure (1) and labor (L) (the remaining 8 hours are for sleeping). The hourly wage is w, and assume that the price of each unit of consumption is $1. The only...
Problem 3 - Labor Market & Taxes
PROBLEM 3: LABOR MARKET AND TAXES (20 POINTS) Suppose a worker has preferences over consumption and leisure that can be repre- sented by the following utility function: U = ln (C) + In (1) There are 16 hours per day available for leisure (1) and labor (L) (the remaining 8 hours are for sleeping). The hourly wage is w, and assume that the price of each unit of consumption is $1. The only...
Market for Unskilled Labor Unskilled Wage Rate/Hour $2.00 S1.50 Labor Demand Curve 10 24 Number af...
 Market for Unskilled Labor Unskilled Wage Rate/Hour $2.00 S1.50 Labor Demand Curve 10 24 Number af Unskilled Warkers (millians) 2. The diagram drawn above shows the market for unskilled labor in which child workers may get hired, depending upon the circumstances. Currently, there are 10 million adult workers who are available for employment at the equilibrium wage rate of $2.00 per hour and no child worker is in the labor force in this market. (i) If the employers offer a...
The graph on the right shows the demand for and supply of labor in a market...
 The graph on the right shows the demand for and supply of labor in a market with an equilibrium wage rate of $9 per hour. Labor supply Show the impact on the graph if a minimum wage of $11 per hour is enacted. 1.) Using the point drawing tool, plot the point that illustrates the quantity of labor demanded when the minimum wage is set at $11 per hour. Label your point 'A.' 2.) Using the point drawing tool, plot...
Factor Market Practice FRQ Cleanlt is a competitive labor market. perfectly competitive, profit-maximizing trash collection firm. Cleanlt hires workers in a perfectly Draw side-by-side graphs for...
 Factor Market Practice FRQ Cleanlt is a competitive labor market. perfectly competitive, profit-maximizing trash collection firm. Cleanlt hires workers in a perfectly Draw side-by-side graphs for the labor market and for Cleanit and show each of the following. a. e market wage, labeled Wm, and the quantity of workers hired in the market, labeled Lm i. The marginal factor (resource) cost curve, labeled MFC ili. The marginal revenue product curve, labeled MRP iv. The wage paid by the firm, labeled...
Consider labor market in an economy. In a classical model, you can think that each worker...
Consider labor market in an economy. In a classical model, you can think that each worker comes with one unitof effort. In a Keynesian model effort makes a difference. Suppose that the efficiency wage is above labor market equilibrium. (a) Draw a graph where you can show both employment and unemployment predicted by each model. Discussunemployment under both models. (b) Now suppose a negative productivity shock hits the economy. How would employment and unemploymentchange under both Classical and Keynesian model....
59. Market equilibrium A market equilibrium is a quantity-price pair in which: A. The government equates the selling and buying price of The price is such that the quantity demanded is equal to t...
 59. Market equilibrium A market equilibrium is a quantity-price pair in which: A. The government equates the selling and buying price of The price is such that the quantity demanded is equal to the The level of happiness among people is as high as possible. supplied quantity supp A price increase would cause people to want to buy 1 of the good. E. The supply curve and demand curve are equivalent. The Marginal Product of Labor (MPL) is equal to...
Question 2 (40 points) Based on Classical model of labor market, how would each of the...
 Question 2 (40 points) Based on Classical model of labor market, how would each of the following events affect full employment and the equilibrium real wage in the U.S.? Your answer should include graphs. A. (8 pts.) A large number of working-age immigrants enter the U.S. B. (8 pts.) Tighter environmental laws temporarily reduce the capital stock. (Assume that the effect on the MPN is the standard one.) C. (8 pts.) Workers start attending night school, which makes their expected...
6) in the U.S., which is not a specific stated goal of Government policies?: a) price...
6) in the U.S., which is not a specific stated goal of Government policies?: a) price stability b) full employment c) growth d) social well-being (welfare, or "happiness") 7) The unemployment rate is defined as: a) civilian labor force/civilian non-institutional population b) unemployed/civilian labor force 0) discouraged workers/civilian labor force d) none of the above , 8) The term "final goods" refers to: a) raw materials b) goods whose value has been adjusted for changes in the price level c)...
Question 70 2.5 pts In the unemployment rate, part-time workers are: not included in the labor...
 Question 70 2.5 pts In the unemployment rate, part-time workers are: not included in the labor force. included in the labor force, but counted as unemployed. treated the same way as discouraged workers. included in the labor force and counted as employed. Question 69 2.5 pts Which of the following would be officially classified as unemployed? O a school administrator who has been working as a substitute teacher one day per week while looking for a full-time job in administration...
 A construction firm builds using two types of labor. The first is more skilled union workers, and the second is lesser skilled non-union workers. 8. a Would you expect the equilibrium wage to be the same or different of each type of worker. Briefly explain b) On separate graphs, show the equilibrium wage and employment for each type of worker Part of the compensation for union workers consists of health care benefits. These benefits cost the firm S1 per hour....
 Problem 3 - Labor Market & Taxes
PROBLEM 3: LABOR MARKET AND TAXES (20 POINTS) Suppose a worker has preferences over consumption and leisure that can be repre- sented by the following utility function: U = ln (C) + In (1) There are 16 hours per day available for leisure (1) and labor (L) (the remaining 8 hours are for sleeping). The hourly wage is w, and assume that the price of each unit of consumption is $1. The only...
Problem 3 - Labor Market & Taxes
PROBLEM 3: LABOR MARKET AND TAXES (20 POINTS) Suppose a worker has preferences over consumption and leisure that can be repre- sented by the following utility function: U = ln (C) + In (1) There are 16 hours per day available for leisure (1) and labor (L) (the remaining 8 hours are for sleeping). The hourly wage is w, and assume that the price of each unit of consumption is $1. The only...
 Market for Unskilled Labor Unskilled Wage Rate/Hour $2.00 S1.50 Labor Demand Curve 10 24 Number af Unskilled Warkers (millians) 2. The diagram drawn above shows the market for unskilled labor in which child workers may get hired, depending upon the circumstances. Currently, there are 10 million adult workers who are available for employment at the equilibrium wage rate of $2.00 per hour and no child worker is in the labor force in this market. (i) If the employers offer a...
 The graph on the right shows the demand for and supply of labor in a market with an equilibrium wage rate of $9 per hour. Labor supply Show the impact on the graph if a minimum wage of $11 per hour is enacted. 1.) Using the point drawing tool, plot the point that illustrates the quantity of labor demanded when the minimum wage is set at $11 per hour. Label your point 'A.' 2.) Using the point drawing tool, plot...
 Factor Market Practice FRQ Cleanlt is a competitive labor market. perfectly competitive, profit-maximizing trash collection firm. Cleanlt hires workers in a perfectly Draw side-by-side graphs for the labor market and for Cleanit and show each of the following. a. e market wage, labeled Wm, and the quantity of workers hired in the market, labeled Lm i. The marginal factor (resource) cost curve, labeled MFC ili. The marginal revenue product curve, labeled MRP iv. The wage paid by the firm, labeled...
 59. Market equilibrium A market equilibrium is a quantity-price pair in which: A. The government equates the selling and buying price of The price is such that the quantity demanded is equal to the The level of happiness among people is as high as possible. supplied quantity supp A price increase would cause people to want to buy 1 of the good. E. The supply curve and demand curve are equivalent. The Marginal Product of Labor (MPL) is equal to...
 Question 2 (40 points) Based on Classical model of labor market, how would each of the following events affect full employment and the equilibrium real wage in the U.S.? Your answer should include graphs. A. (8 pts.) A large number of working-age immigrants enter the U.S. B. (8 pts.) Tighter environmental laws temporarily reduce the capital stock. (Assume that the effect on the MPN is the standard one.) C. (8 pts.) Workers start attending night school, which makes their expected...
 Question 70 2.5 pts In the unemployment rate, part-time workers are: not included in the labor force. included in the labor force, but counted as unemployed. treated the same way as discouraged workers. included in the labor force and counted as employed. Question 69 2.5 pts Which of the following would be officially classified as unemployed? O a school administrator who has been working as a substitute teacher one day per week while looking for a full-time job in administration...
Most questions answered within 3 hours.
-
A telephone survey uses a random digit dialing machine to call
subjects. The random digit dialing...
asked 18 minutes ago -
How can having too little or too much of a certain
protein cause problems for an...
asked 1 hour ago -
Assume a muscle has a PCSA = 20 cm2 and Lo = 12 cm. Assume it...
asked 3 hours ago -
What is the yield to maturity of a ten-year, $1,000 bond with a
5.2% coupon rate...
asked 3 hours ago -
A mass m = 5 kg is tied on one end of a rope and is...
asked 4 hours ago -
The Average sales price of single-family houses in Charlotte is
$210,000 with a standard deviation of...
asked 4 hours ago -
Target Costing
Laser Impressions, Inc., manufactures color laser printers.
Model J20 presently sells for $225 and...
asked 4 hours ago -
a bottle cap manufacturer with four machines and six operators
wants to see if variation in...
asked 5 hours ago -
State Farm Insurance studies show that in Colorado, 55% of the
auto insurance claims submitted for...
asked 5 hours ago -
Complete the following reactions which form ethers (A
and B) and cyclic ethers (C-E) as major...
asked 6 hours ago -
in a perfectly elastic collision what is the velocity of ball A
if the original direction...
asked 6 hours ago -
PLEASE ANSWER ALL
1) The pressure of the atmosphere decreases with increasing
altitude in the
Choose...
asked 6 hours ago