How to find the sample autocorrelation function (ACF) using SPSS and how to tell if the...
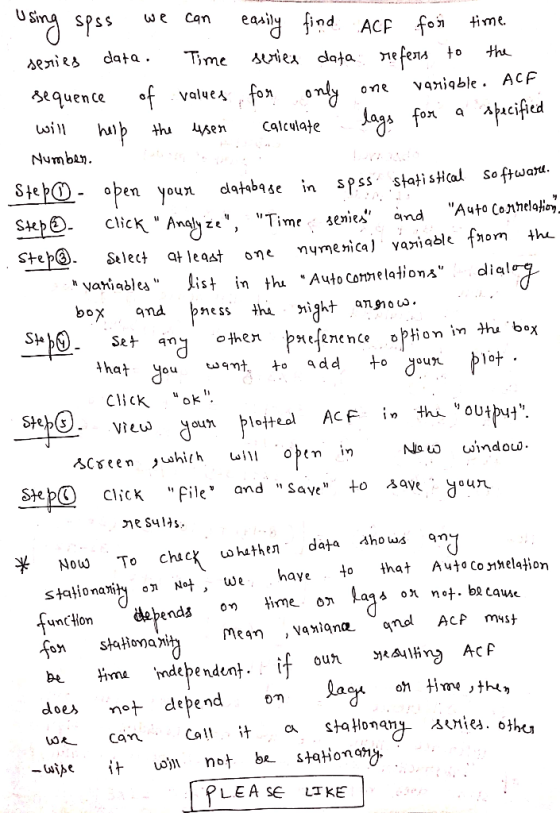
How to find the sample autocorrelation function (ACF) using SPSS and how to tell if the data show any stationarity
Homework Answers


Add Answer to:
How to find the sample autocorrelation function (ACF)
using SPSS and how to tell if the...
5. For the processes X 0.4X,-1 Zt -0.7Zi-1, (i) Simulate and plot 100 values of the processes; (ii) Compute and graph their theoretical ACF and PACF using R. (iii) Compute and graph their sample ACF...
 5. For the processes X 0.4X,-1 Zt -0.7Zi-1, (i) Simulate and plot 100 values of the processes; (ii) Compute and graph their theoretical ACF and PACF using R. (iii) Compute and graph their sample ACF and PACF using R. How do sample functions compare to their theoretical counterparts? (iv) Analyze smoothness of the simulated processes using their ACF's. Please include the code with clear comments explaining the meaning of the code. Make sure to label the graphs.
5. For the...
5. For the processes X 0.4X,-1 Zt -0.7Zi-1, (i) Simulate and plot 100 values of the processes; (ii) Compute and graph their theoretical ACF and PACF using R. (iii) Compute and graph their sample ACF and PACF using R. How do sample functions compare to their theoretical counterparts? (iv) Analyze smoothness of the simulated processes using their ACF's. Please include the code with clear comments explaining the meaning of the code. Make sure to label the graphs.
5. For the...
(b) Jan has collected a monthly time series consisting of 167 observations on the differenced log Yen/SAU exchange rate and plotted the sample ACF for the series (see below). Use the QLB(2) statistic...
 (b) Jan has collected a monthly time series consisting of 167 observations on the differenced log Yen/SAU exchange rate and plotted the sample ACF for the series (see below). Use the QLB(2) statistic to test whether or not the series is a white-noise process at the 5% level of significance. Write down your hypotheses, decision rule and conclusion. [3 marks] Lag-1.00 -0.60-0.20 0.20 0.60 ACF 1.00 I 0.001073 0.121080 1 -0.084039 1 -0.052353 I -0.054732 1 -0.095489 0 . 044049...
4. Find and the autocorrelation function R (t) of the following signal : x( Find the...
 4. Find and the autocorrelation function R (t) of the following signal : x( Find the energy Ex
Please explain your answer Consider the plot of the sample autocorrelation function for the residuals from...
 Please explain your answer
Consider the plot of the sample autocorrelation function for the residuals from the model fit in 9 in Figure 6. Series Residual.Seasonal 2 4 10 12 Lag Figure 6 Which of the following statements is correct? There is a strong positive autocorrelation at the first several lags. There are several significant spikes. There is a discernible pattern in higher-order lags. None
Please explain your answer
Consider the plot of the sample autocorrelation function for the residuals from the model fit in 9 in Figure 6. Series Residual.Seasonal 2 4 10 12 Lag Figure 6 Which of the following statements is correct? There is a strong positive autocorrelation at the first several lags. There are several significant spikes. There is a discernible pattern in higher-order lags. None
Part a calculate the sample autocorrelation function and provide an interpretation part b constru...
part a calculate the sample autocorrelation function and provide an interpretation part b construct an individual control chart with the standard deviation estimated using the moving range method. how would ypu interpret the chart? are ypu comfortable with this interpretation? data 2048, 2025, 2017, 1995, 1983, 1943, 1940, 1947, 1972, 1983, 1935, 1948, 1966, 1954, 1970, 2039, 2015, 2021, 2010, 2012, 2003, 1979, 2006, 2042, 2000, 2002, 2010, 1975, 1983, 2021, 2051, 2056, 2018, 2030, 2023, 2036, 2019, 2000, 1986,...
Question 2 (a) The following table gives the sample autocorrelation coefficients and partial autocorrelation coefficients for...
 Question 2 (a) The following table gives the sample autocorrelation coefficients and partial autocorrelation coefficients for a time series with 100 observations. 4 ,-0.55 -0.17 0.09 0.0.00.010.040.07 -0.55 | -0.4 0.29 | -0.22 -0.11- -0.13 -0.14 0,05 Suppose the sample mean of the time series is zero. Based on the above information, suggest an ARMA model for the data. Briefly explain your answer. (5 marks) (b) Let X, be a time series satisfying the following AR(2)model: X, = 0.3X,-1 +0.04X,-2...
1. Find the power spectrum of the random process with autocorrelation function - 0, otherwise. Problem...
 1. Find the power spectrum of the random process with autocorrelation function - 0, otherwise. Problem required for BME6012, extra credit for BME5112.]
Question 2 (a) The following table gives the sample autocorrelation coefficients and partial auto...
 Question 2 (a) The following table gives the sample autocorrelation coefficients and partial autocorrelation coefficients for a time series with 100 observations. 4 ,-0.55 -0.17 0.09 0.0.00.010.040.07 -0.55 | -0.4 0.29 | -0.22 -0.11- -0.13 -0.14 0,05 Suppose the sample mean of the time series is zero. Based on the above information, suggest an ARMA model for the data. Briefly explain your answer. (5 marks) (b) Let X, be a time series satisfying the following AR(2)model: X, = 0.3X,-1 +0.04X,-2...
I. The autocorrelation function of a random signal is R(r) !-ⓞrect rect a. Find the power...
 I. The autocorrelation function of a random signal is R(r) !-ⓞrect rect a. Find the power spectral density of the signal. b. Plot the amplitude of the power spectral density with Matlab (Let Ts -2) c. Find the null-to-null bandpass bandwidth, and the 0-to-null baseband bandwidth (in terms of Ts).
Using graphical correlation, find the autocorrelation for the following 2 bit Barker codes: a) +1 -1...
Using graphical correlation, find the autocorrelation for the following 2 bit Barker codes: a) +1 -1 b) +1 +1 c) Find the cross correlation of the code in a) and the code in b)
 5. For the processes X 0.4X,-1 Zt -0.7Zi-1, (i) Simulate and plot 100 values of the processes; (ii) Compute and graph their theoretical ACF and PACF using R. (iii) Compute and graph their sample ACF and PACF using R. How do sample functions compare to their theoretical counterparts? (iv) Analyze smoothness of the simulated processes using their ACF's. Please include the code with clear comments explaining the meaning of the code. Make sure to label the graphs.
5. For the...
5. For the processes X 0.4X,-1 Zt -0.7Zi-1, (i) Simulate and plot 100 values of the processes; (ii) Compute and graph their theoretical ACF and PACF using R. (iii) Compute and graph their sample ACF and PACF using R. How do sample functions compare to their theoretical counterparts? (iv) Analyze smoothness of the simulated processes using their ACF's. Please include the code with clear comments explaining the meaning of the code. Make sure to label the graphs.
5. For the...
 (b) Jan has collected a monthly time series consisting of 167 observations on the differenced log Yen/SAU exchange rate and plotted the sample ACF for the series (see below). Use the QLB(2) statistic to test whether or not the series is a white-noise process at the 5% level of significance. Write down your hypotheses, decision rule and conclusion. [3 marks] Lag-1.00 -0.60-0.20 0.20 0.60 ACF 1.00 I 0.001073 0.121080 1 -0.084039 1 -0.052353 I -0.054732 1 -0.095489 0 . 044049...
 4. Find and the autocorrelation function R (t) of the following signal : x( Find the energy Ex
 Please explain your answer
Consider the plot of the sample autocorrelation function for the residuals from the model fit in 9 in Figure 6. Series Residual.Seasonal 2 4 10 12 Lag Figure 6 Which of the following statements is correct? There is a strong positive autocorrelation at the first several lags. There are several significant spikes. There is a discernible pattern in higher-order lags. None
Please explain your answer
Consider the plot of the sample autocorrelation function for the residuals from the model fit in 9 in Figure 6. Series Residual.Seasonal 2 4 10 12 Lag Figure 6 Which of the following statements is correct? There is a strong positive autocorrelation at the first several lags. There are several significant spikes. There is a discernible pattern in higher-order lags. None
 Question 2 (a) The following table gives the sample autocorrelation coefficients and partial autocorrelation coefficients for a time series with 100 observations. 4 ,-0.55 -0.17 0.09 0.0.00.010.040.07 -0.55 | -0.4 0.29 | -0.22 -0.11- -0.13 -0.14 0,05 Suppose the sample mean of the time series is zero. Based on the above information, suggest an ARMA model for the data. Briefly explain your answer. (5 marks) (b) Let X, be a time series satisfying the following AR(2)model: X, = 0.3X,-1 +0.04X,-2...
 1. Find the power spectrum of the random process with autocorrelation function - 0, otherwise. Problem required for BME6012, extra credit for BME5112.]
 Question 2 (a) The following table gives the sample autocorrelation coefficients and partial autocorrelation coefficients for a time series with 100 observations. 4 ,-0.55 -0.17 0.09 0.0.00.010.040.07 -0.55 | -0.4 0.29 | -0.22 -0.11- -0.13 -0.14 0,05 Suppose the sample mean of the time series is zero. Based on the above information, suggest an ARMA model for the data. Briefly explain your answer. (5 marks) (b) Let X, be a time series satisfying the following AR(2)model: X, = 0.3X,-1 +0.04X,-2...
 I. The autocorrelation function of a random signal is R(r) !-ⓞrect rect a. Find the power spectral density of the signal. b. Plot the amplitude of the power spectral density with Matlab (Let Ts -2) c. Find the null-to-null bandpass bandwidth, and the 0-to-null baseband bandwidth (in terms of Ts).
Most questions answered within 3 hours.
-
At the start of a CD it is spinning at a rate of 525 rpm
(revolutions...
asked 27 minutes ago -
4. Without doing any calculations, predict whether the observed
∆T would increase, decrease or remain the...
asked 1 hour ago -
Based on the range, which of the following sets of scores has
the greatest variability? 3,...
asked 2 hours ago -
Ripples in a pond travel at a velocity of 3 m/s with one peak
passing a...
asked 2 hours ago -
A man stands on the roof of a building of height 13.0 mm and
throws a...
asked 2 hours ago -
The extent to which assets are financed by borrowed funds and
other liabilities is indicated by:...
asked 3 hours ago -
Explain in detail
Germany is the fifth largest economy
explain what goods and services Germany specializes...
asked 4 hours ago -
The density of platinum is 21.45 g/mL. If a cube of platinum
with a mass of...
asked 4 hours ago -
Accounts Receivable
Sales
A/R Posting
Extended Sales Invoice
Packing Slip
Compare invoice to packing slip 2...
asked 4 hours ago -
Michaella, age 23, is a full-time law student and is claimed by
her parents as a...
asked 4 hours ago -
Why are polymers not typically casted into products?
asked 4 hours ago -
When rolling a die 129 times, what is the probability of rolling
a 6 no more...
asked 4 hours ago