
Homework Answers
Income elasticity of Demand of horses=(% change in quantity
demanded)/quantity demanded/(% change in Income)/Income
=6%/18%=0.33
Inelastic
Horses are normal good
Income elasticity of Demand of clubs=(% change in quantity
demanded)/quantity demanded/(% change in Income)/Income
=17%/18%=0.9444
Inelastic or very much close to unitary elastic
Clubs are Inferior goods
Income elasticity of Demand of diamonds=(% change in quantity
demanded)/quantity demanded/(% change in Income)/Income
=29%/18%=1.611
Elastic
Diamonds are Luxury goods because %increase in the income level are
lower than % change in consumption of goods in question
DIAMONDS are luxury good for above reason
Add Answer to:
7. Using the income elasticity of demand to characterize goods Data collected from the economy of...
7. Using the income elasticity of demand to characterize goods Data collected from the economy of...
 7. Using the income elasticity of demand to characterize goods Data collected from the economy of Royal City reveals that a 14% decrease in income leads to the following changes: . An 11% increase in the quantity of clubs demanded . A 2% decrease in the quantity of chips demanded . A 27% decrease in the quantity of houses demanded Compute the income elasticity of demand for each good and use the dropdown menus to complete the first column in...
7. Using the income elasticity of demand to characterize good:s Data collected from the economy of...
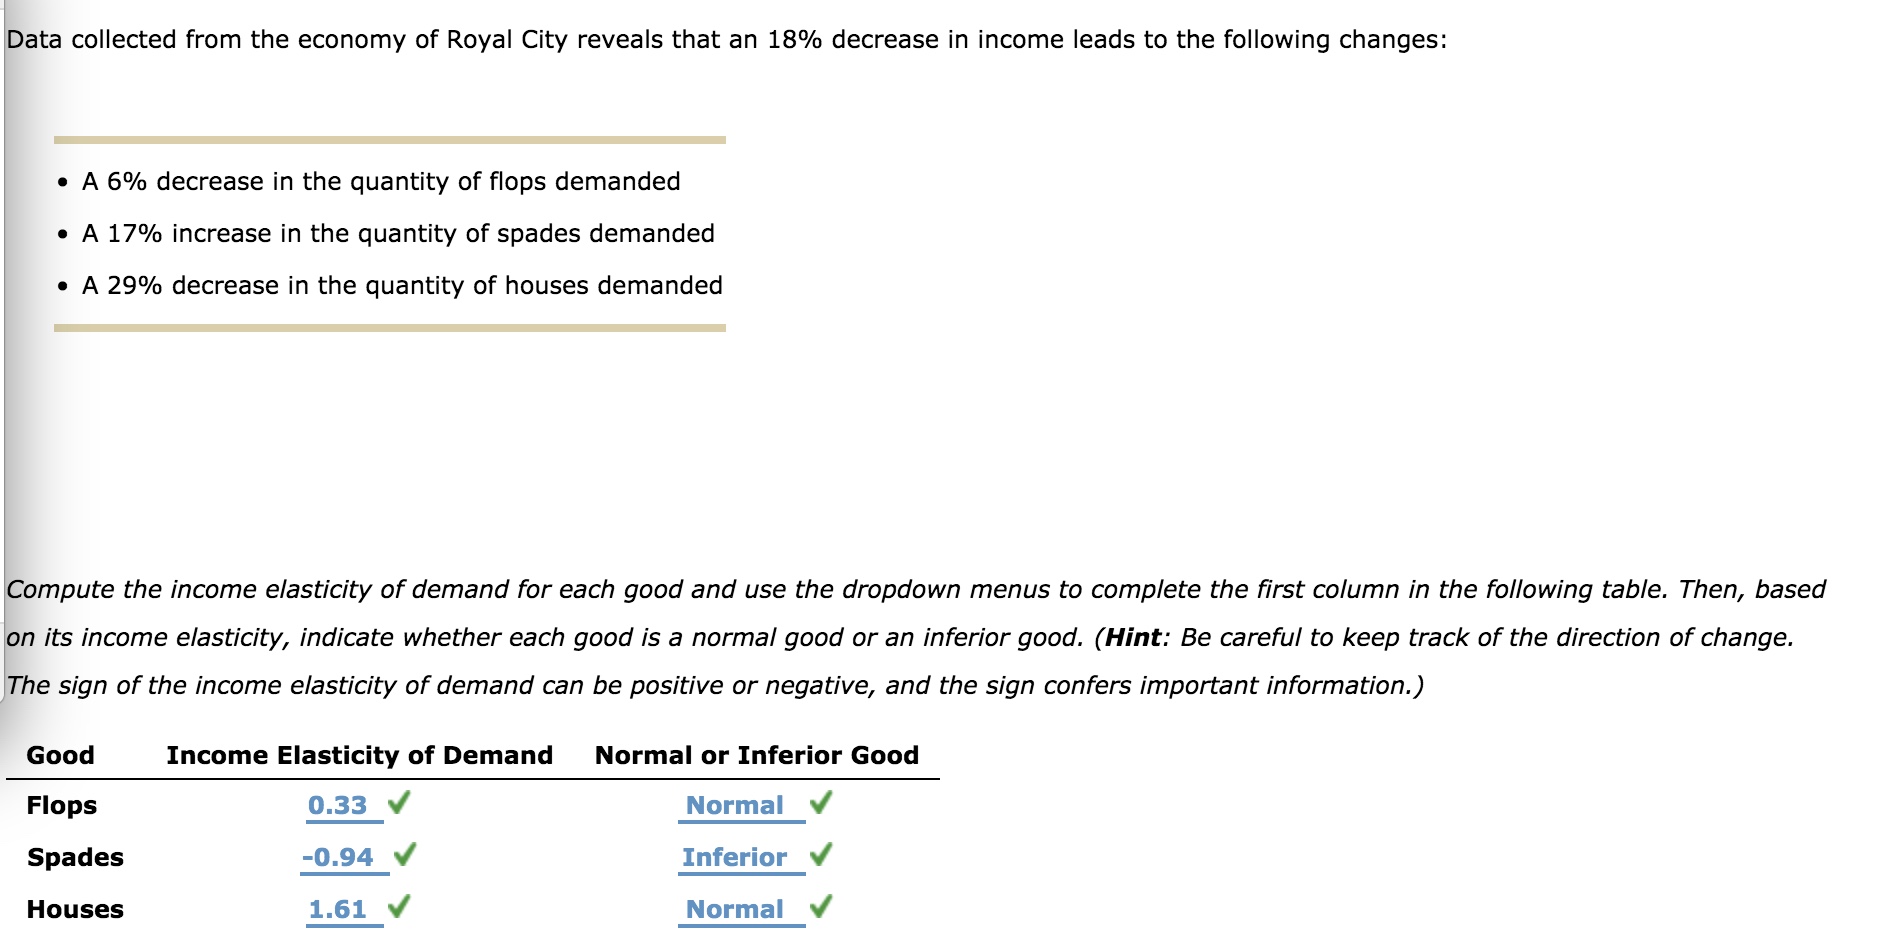
 7. Using the income elasticity of demand to characterize good:s Data collected from the economy of Cardtown reveals that an 18% decrease in income leads to the following changes: ·A 6% decrease in the quantity of flops demanded ·A 17% increase in the quantity of clubs demanded A 29% decrease in the quantity of houses demanded Compute the income elasticity of demand for each good and use the dropdown menus to complete the first column in the following table. Then,...
7. Using the income elasticity of demand to characterize goods Data collected from the economy of...
 7. Using the income elasticity of demand to characterize goods Data collected from the economy of Royal City reveals that a 16% increase in income leads to the following changes: . An 18% increase in the quantity of horses demanded . A 14% decrease in the quantity of spades demanded . A 30% increase in the quantity of aces demanded Compute the income elasticity of demand for each good and use the dropdown menus to complete the first column in the following table. Then, based...
Attempts: Do No Harm: /2 7. Using the income elasticity of demand to characterize goods Data...
 Attempts: Do No Harm: /2 7. Using the income elasticity of demand to characterize goods Data collected from the economy of Cardtown reveals that an 18% increase in income leads to the following changes: • A 29% increase in the quantity of houses demanded • A 17% decrease in the quantity of clubs demanded • A 14% increase in the quantity of chips demanded Compute the income elasticity of demand for each good and use the dropdown menus to complete...
Data collected from the economy of Pokerville reveals that a 15% decrease in income leads to the following changes:
 Data collected from the economy of Pokerville reveals that a 15% decrease in income leads to the following changes: A 9% increase in the quantity of clubs demanded . A 17% decrease in the quantity of horses demanded . A 29% decrease in the quantity of aces demanded Compute the income elasticity of demand for each good and use the dropdown menus to complete the first column in the following table. Then, based on its income elasticity, indicate whether each good is a normal...
Data collected from the economy of Cardtown reveals that a 16% increase in income leads to...
Data collected from the economy of Cardtown reveals that a 16% increase in income leads to the following changes: • A 6% increase in the quantity of chips demanded • A 14% decrease in the quantity of clubs demanded • A 29% increase in the quantity of diamonds demanded Compute the income elasticity of demand for each good and use the dropdown menus to complete the first column in the following table. Then, based on its income elasticity, indicate whether...
Income Elasticity of Demand Normal Or Inferior Good Clubs (-1.22, -0.82, 0.82, 1.22) (Normal, Inferior) Chips...
 Income Elasticity of Demand Normal Or Inferior Good
Clubs (-1.22, -0.82, 0.82, 1.22) (Normal, Inferior)
Chips (-1.1, -0.91, 0.91, 1.1) (Normal, Inferior)
Diamonds (-2.73, -0.37, 0.37, 2.73) (Normal, Inferior)
Data collected from the economy of Cardtown reveals that an 11% decrease in income leads to the following changes: • A 9% increase in the quantity of clubs demanded • A 10% decrease in the quantity of chips demanded • A 30% decrease in the quantity of diamonds demanded Compute the...
Income Elasticity of Demand Normal Or Inferior Good
Clubs (-1.22, -0.82, 0.82, 1.22) (Normal, Inferior)
Chips (-1.1, -0.91, 0.91, 1.1) (Normal, Inferior)
Diamonds (-2.73, -0.37, 0.37, 2.73) (Normal, Inferior)
Data collected from the economy of Cardtown reveals that an 11% decrease in income leads to the following changes: • A 9% increase in the quantity of clubs demanded • A 10% decrease in the quantity of chips demanded • A 30% decrease in the quantity of diamonds demanded Compute the...
Data collected from the economy of Royal City reveals that a 16% increase in income leads...
 Data collected from the economy of Royal City reveals that a 16% increase in income leads to the following changes: . A 12% increase in the quantity of flops demanded . A 14% decrease in the quantity of clubs demanded . A 28% increase in the quantity of houses demanded Compute the income elasticity of demand for each good and use the dropdown menus to complete the first column in the following table. Then, based on its income elasticity, indicate...
PLEASE READ CAREFULLY & WRITING MUST BE CLEAR TO READ!! THANKS!! 6. Using the income elasticity...
 PLEASE READ CAREFULLY & WRITING MUST BE CLEAR TO READ!!
THANKS!!
6. Using the income elasticity of demand to characterize goods Data collected from the economy of Cardtown reveals that a 14% decrease in income leads to the following changes: . An 11% increase in the quantity of spades demanded . A 2% decrease in the quantity of chips demanded . A 27% decrease in the quantity of diamonds demanded Compute the income elasticity of demand for each good and...
PLEASE READ CAREFULLY & WRITING MUST BE CLEAR TO READ!!
THANKS!!
6. Using the income elasticity of demand to characterize goods Data collected from the economy of Cardtown reveals that a 14% decrease in income leads to the following changes: . An 11% increase in the quantity of spades demanded . A 2% decrease in the quantity of chips demanded . A 27% decrease in the quantity of diamonds demanded Compute the income elasticity of demand for each good and...
5. Using the income elasticity of demand to characterize goods Aa Aa Data collected in the...
 5. Using the income elasticity of demand to characterize goods Aa Aa Data collected in the imaginary economy of Tralfamadore reveals that a 10% increase in income leads to the following changes: * A6% decrease in the quantity demanded of kang * A9% increase in the quantity demanded of sogem - A 21% increase in the quantity demanded of welk The income elasticity of demand for sogem is . (Be careful to keep track of the direction of change. Like...
 7. Using the income elasticity of demand to characterize goods Data collected from the economy of Royal City reveals that a 14% decrease in income leads to the following changes: . An 11% increase in the quantity of clubs demanded . A 2% decrease in the quantity of chips demanded . A 27% decrease in the quantity of houses demanded Compute the income elasticity of demand for each good and use the dropdown menus to complete the first column in...
 7. Using the income elasticity of demand to characterize good:s Data collected from the economy of Cardtown reveals that an 18% decrease in income leads to the following changes: ·A 6% decrease in the quantity of flops demanded ·A 17% increase in the quantity of clubs demanded A 29% decrease in the quantity of houses demanded Compute the income elasticity of demand for each good and use the dropdown menus to complete the first column in the following table. Then,...
 Attempts: Do No Harm: /2 7. Using the income elasticity of demand to characterize goods Data collected from the economy of Cardtown reveals that an 18% increase in income leads to the following changes: • A 29% increase in the quantity of houses demanded • A 17% decrease in the quantity of clubs demanded • A 14% increase in the quantity of chips demanded Compute the income elasticity of demand for each good and use the dropdown menus to complete...
 Income Elasticity of Demand Normal Or Inferior Good
Clubs (-1.22, -0.82, 0.82, 1.22) (Normal, Inferior)
Chips (-1.1, -0.91, 0.91, 1.1) (Normal, Inferior)
Diamonds (-2.73, -0.37, 0.37, 2.73) (Normal, Inferior)
Data collected from the economy of Cardtown reveals that an 11% decrease in income leads to the following changes: • A 9% increase in the quantity of clubs demanded • A 10% decrease in the quantity of chips demanded • A 30% decrease in the quantity of diamonds demanded Compute the...
Income Elasticity of Demand Normal Or Inferior Good
Clubs (-1.22, -0.82, 0.82, 1.22) (Normal, Inferior)
Chips (-1.1, -0.91, 0.91, 1.1) (Normal, Inferior)
Diamonds (-2.73, -0.37, 0.37, 2.73) (Normal, Inferior)
Data collected from the economy of Cardtown reveals that an 11% decrease in income leads to the following changes: • A 9% increase in the quantity of clubs demanded • A 10% decrease in the quantity of chips demanded • A 30% decrease in the quantity of diamonds demanded Compute the...
 Data collected from the economy of Royal City reveals that a 16% increase in income leads to the following changes: . A 12% increase in the quantity of flops demanded . A 14% decrease in the quantity of clubs demanded . A 28% increase in the quantity of houses demanded Compute the income elasticity of demand for each good and use the dropdown menus to complete the first column in the following table. Then, based on its income elasticity, indicate...
 PLEASE READ CAREFULLY & WRITING MUST BE CLEAR TO READ!!
THANKS!!
6. Using the income elasticity of demand to characterize goods Data collected from the economy of Cardtown reveals that a 14% decrease in income leads to the following changes: . An 11% increase in the quantity of spades demanded . A 2% decrease in the quantity of chips demanded . A 27% decrease in the quantity of diamonds demanded Compute the income elasticity of demand for each good and...
PLEASE READ CAREFULLY & WRITING MUST BE CLEAR TO READ!!
THANKS!!
6. Using the income elasticity of demand to characterize goods Data collected from the economy of Cardtown reveals that a 14% decrease in income leads to the following changes: . An 11% increase in the quantity of spades demanded . A 2% decrease in the quantity of chips demanded . A 27% decrease in the quantity of diamonds demanded Compute the income elasticity of demand for each good and...
 5. Using the income elasticity of demand to characterize goods Aa Aa Data collected in the imaginary economy of Tralfamadore reveals that a 10% increase in income leads to the following changes: * A6% decrease in the quantity demanded of kang * A9% increase in the quantity demanded of sogem - A 21% increase in the quantity demanded of welk The income elasticity of demand for sogem is . (Be careful to keep track of the direction of change. Like...
Most questions answered within 3 hours.
-
If you were an international firm, why would you support the
concept of global free trade?...
asked 8 minutes ago -
Cisco packet tracer
Q1) Do you get any changes of IP address when packet is
traversing...
asked 51 minutes ago -
What is the pressure inside a 33.0 L container holding 106.4 kg
of argon gas at...
asked 1 hour ago -
Question no 2
A housekeeping support department budgets its costs at
SR 40,000 per month plus...
asked 1 hour ago -
A 1400Kg sports car accelerates from rest to 90km/h in 7.0s.
What is the average power...
asked 2 hours ago -
For the following reaction, 0.128 moles of
potassium hydrogen sulfateare mixed with
0.504 moles of potassium...
asked 5 hours ago -
1. What is the present value of $400, three years in the future
if the interest...
asked 6 hours ago -
The labor force minus the number of employed equals the number
of unemployed.
a. True
b....
asked 8 hours ago -
Determine the mass in units of grams [g] of 0.49 moles [mol]
of a new fictitious...
asked 8 hours ago -
A horizontal mass of M=5kg is on a spring and stretched to
x=0.5m when released from...
asked 10 hours ago -
26 of 50
"I have worked at the Arizona Humane Society for ten years, and
have...
asked 10 hours ago -
Compare and contrast zero based budgeting and incremental (or
base year) budgeting.
asked 10 hours ago