The FBI wants to determine the effectiveness of their 10 Most Wanted list. To do so,...
The FBI wants to determine the effectiveness of their 10 Most Wanted list. To do so, they need to find out the fraction of people who appear on the list that are actually caught.
Step 1 of 2: Suppose a sample of 369 suspected criminals is drawn. Of these people, 118 were captured. Using the data, estimate the proportion of people who were caught after being on the 10 Most Wanted list. Enter your answer as a fraction or a decimal number rounded to three decimal places.
______
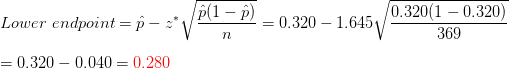
Step 2 of 2: Suppose a sample of 369 suspected criminals is drawn. Of these people, 118 were captured. Using the data, construct the 90% confidence interval for the population proportion of people who are captured after appearing on the 10 Most Wanted list. Round your answers to three decimal places.
Lower Endpoint:_____ Upper Endpoint:_____
Homework Answers
a) The sample proportion is:

------------------------------------------------------------------------------------------------------
b) For 90% confidence level, critical value of z is  .
.

Add Answer to:
The FBI wants to determine the effectiveness of their 10 Most
Wanted list. To do so,...
The FBI wants to determine the effectiveness of their 10 Most Wanted list. To do so,...
The FBI wants to determine the effectiveness of their 10 Most Wanted list. To do so, they need to find out the fraction of people who appear on the list that are actually caught. Step 1 of 2 : Suppose a sample of 782 suspected criminals is drawn. Of these people, 273 were captured. Using the data, estimate the proportion of people who were caught after being on the 10 Most Wanted list. Enter your answer as a fraction or...
The FBI wants to determine the effectiveness of their 10 Most Wanted list. To do so,...
The FBI wants to determine the effectiveness of their 10 Most Wanted list. To do so, they need to find out the fraction of people who appear on the list that are actually caught. Step 1 of 2: Suppose a sample of 283 suspected criminals is drawn. Of these people, 93 were captured. Using the data, estimate the proportion of people who were caught after being on the 1010 Most Wanted list. Enter your answer as a fraction or a...
The FBI wants to determine the effectiveness of their 10 Most Wanted list. To do so,...
The FBI wants to determine the effectiveness of their 10 Most Wanted list. To do so, they need to find out the fraction of people who appear on the list that are actually caught. Step 1 of 2: Suppose a sample of 547 suspected criminals is drawn. Of these people, 362 were not captured. Using the data, estimate the proportion of people who were caught after being on the 10 Most Wanted list. Enter your answer as a fraction or...
The FBI wants to determine the effectiveness of their 10 Most Wanted list. To do so,...
The FBI wants to determine the effectiveness of their 10 Most Wanted list. To do so, they need to find out the fraction of people who appear on the list that are actually caught. Step 2 of 2 : Suppose a sample of 233 suspected criminals is drawn. Of these people, 72 were captured. Using the data, construct the 880% confidence interval for the population proportion of people who are captured after appearing on the 10 Most Wanted list. Round...
The FBI wants to determine the effectiveness of their 10 Most Wanted list. To do so,...
 The FBI wants to determine the effectiveness of their 10 Most Wanted list. To do so, they need to find out the fraction of people who appear on the list that are actually caught Step 2 of 2: Suppose a sample of 1718 suspected criminals is drawn, or these people, 687 were captured. Using the data, construct the 99% confidence interval for the population proportion of people who are captured after appearing on the 10 Most Wanted list. Round your...
The FBI wants to determine the effectiveness of their 1010 Most Wanted list. To do so,...
The FBI wants to determine the effectiveness of their 1010 Most Wanted list. To do so, they need to find out the fraction of people who appear on the list that are actually caught. Step 2 of 2 : Suppose a sample of 1753 suspected criminals is drawn. Of these people, 701 were captured. Using the data, construct the 99% confidence interval for the population proportion of people who are captured after appearing on the 1010 Most Wanted list. Round...
The FBI wants to determine the effectiveness of their 10 Most Wanted list. To do so,...
The FBI wants to determine the effectiveness of their 10 Most Wanted list. To do so, they need to find out the fraction of people who appear on the list that are actually caught. Step 2 of 2 : Suppose a sample of 465 suspected criminals is drawn. Of these people, 111 were captured. Using the data, construct the 85% confidence interval for the population proportion of people who are captured after appearing on the 10 Most Wanted list. Round...
The FBI wants to determine the effectiveness of their 10 Most Wanted list. To do so,...
The FBI wants to determine the effectiveness of their 10 Most Wanted list. To do so, they need to find out the fraction of people who appear on the list that are actually caught. Step 2 of 2 : Suppose a sample of 739 suspected criminals is drawn. Of these people, 236 were captured. Using the data, construct the 98% confidence interval for the population proportion of people who are captured after appearing on the 10 Most Wanted list. Round...
The FBI wants to determine the effectiveness of their 10 Most Wanted list. To do so,...
The FBI wants to determine the effectiveness of their 10 Most Wanted list. To do so, they need to find out the fraction of people who appear on the list that are actually caught. Step 2 of 2 : Suppose a sample of 233 suspected criminals is drawn. Of these people, 72 were captured. Using the data, construct the 80% confidence interval for the population proportion of people who are captured after appearing on the 10 Most Wanted list. Round...
 The FBI wants to determine the effectiveness of their 10 Most Wanted list. To do so, they need to find out the fraction of people who appear on the list that are actually caught Step 2 of 2: Suppose a sample of 1718 suspected criminals is drawn, or these people, 687 were captured. Using the data, construct the 99% confidence interval for the population proportion of people who are captured after appearing on the 10 Most Wanted list. Round your...
Most questions answered within 3 hours.
-
A uniform thin rod of length 0.851 m is hung from a horizontal
nail passing through...
asked 1 minute ago -
A 747 has a cruising speed of 235 m/s at a height of 10,700
meters. The...
asked 10 minutes ago -
Part 3: Arrows
Write a python program that prompts the user for a number of
columns,...
asked 17 minutes ago -
Need help answering these questions!!
1. What economic concept do you find most interesting in
Macroeconomics?...
asked 22 minutes ago -
1. Nimbus, Inc. produces and sells brooms. This table shows the
relationship between the number of...
asked 25 minutes ago -
A gas occupies 200. mL in a piston. If the pressure of the
piston were decreased...
asked 42 minutes ago -
A fossil is found to have a 14C level of 71.0% compared to
living organisms. How...
asked 45 minutes ago -
Many communist or socialist countries have a department that
addresses public health as well as the...
asked 47 minutes ago -
the following questions are either true or false answers
1. The Central Limit Theorem allows one...
asked 48 minutes ago -
The patient recovery time from a particular surgical procedure
is normally distributed with a mean of...
asked 54 minutes ago -
Human relations refer to the way a company arranges people,
jobs, and communications so that work...
asked 1 hour ago -
Python Program: Design the logic for and implement a program
that merges the two files into...
asked 1 hour ago