1. 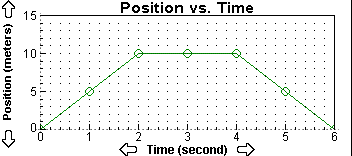
The graph shows the motion of an object traveling in a straight line as a function of time. What is the average speed of the object during the first two seconds?
|
5 m/s |
|
|
2.5 m/s |
|
|
10 m/s |
|
|
20 m/s |
2. 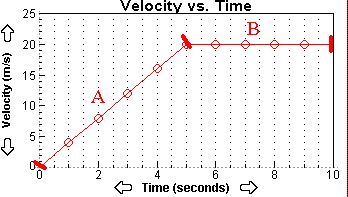
Using the velocity versus time graph, what was the average acceleration of the object during segment B?
|
0 m/s/s |
|
|
20 ms/s |
|
|
10 m/s/s |
|
|
5 m/s/s |
3. Remember to identify all your data, write the equation, and show your work.
While driving her new Camaro at 20.0 m/s down a four-lane highway, Jessica comes up behind a slow-moving dump truck and decides to pass in the left-hand lane.
If Jessica can accelerate at a rate of 5.0 m/s2, how long will it take for her to reach a speed of 30.0 m/s?
Homework Answers
 ***************************************************************************************************
Check the answer and let me know immediately if you
find something wrong... I will rectify the mistakes asap if
any
Add Answer to:
1.
The graph shows the motion of an object traveling in a straight
line as a...
The graph below represents the motion of an object moving along a straight line. What was...
 The graph below represents the motion of an object moving along a straight line. What was the average speed of the object for the first 6.0 s? 5 velocity (m/s) 0 5 10 15 time (s) 3.0 m/s 3.3 m/s 5.0 m/s O 1.3 m/s 1.8 m/s A woman exerts a constant horizontal force on a large box. As a result, the box moves across a horizontal floor at a constant speed vo. If the woman doubles the constant horizontal...
The graph below describes the position x vs time of an object. Draw as precisely as...
 The graph below describes the position x vs time of an
object.
Draw as precisely as you can a motion diagram below: (dots,
starting at 0 [m] every 2 seconds)
Draw a graph below it to represent the velocity vs time of the
cart
Position (m) vs time[s] 10 9 CO 7 그림 영역 6 5 4 3 2. 1 0 0 5 10 15 20 25 t a. Draw as precisely as you can a motion diagram below: (dots,...
The graph below describes the position x vs time of an
object.
Draw as precisely as you can a motion diagram below: (dots,
starting at 0 [m] every 2 seconds)
Draw a graph below it to represent the velocity vs time of the
cart
Position (m) vs time[s] 10 9 CO 7 그림 영역 6 5 4 3 2. 1 0 0 5 10 15 20 25 t a. Draw as precisely as you can a motion diagram below: (dots,...
4. The following graph represents the position of an object, moving along a horizontal line as...
 4. The following graph represents the position of an object, moving along a horizontal line as a function of time. The positive direction is East and negative direction is West. Express all answers to two significant figures. (5 marks) Position Vs. Time 15 10 6 8 10 12 14 16 18 -10 -15 Time, t, (s) a) Over what time interval(s), if any, is the object stopped? b) At what time(s), if any, does the object change direction? c) Determine...
The following is a position-time graph for an object during a 5.0s time interval Time (s)...
 The following is a position-time graph for an object during a 5.0s time interval Time (s) 8. Which graph of velocity versus time would best represent the object's motion during the same time interval? 띠 Tane n 9. Which graph in diagram 1-36 below represents the motion of an object increasing in velocity? ER) CB) IC) Diegrem 1-36 10. A man walks at a speed of 3.00 m/s for 400 seconds, and then walks at 4.00 m/s for 300 seconds....
The graph shows the speed of a car traveling in a straight line as a function...
 The graph shows the speed of a car traveling in a straight line
as a function of time.
The value of vc is 4.10 m/s and the value of
vd is 7.40 m/s. Calculate the distance traveled by the
car from a time of 2.30 to 6.30 seconds.
Vd Tl 0 2 3 4 5 6 8 1 7 TIme, s
The graph shows the speed of a car traveling in a straight line
as a function of time.
The value of vc is 4.10 m/s and the value of
vd is 7.40 m/s. Calculate the distance traveled by the
car from a time of 2.30 to 6.30 seconds.
Vd Tl 0 2 3 4 5 6 8 1 7 TIme, s
x (m) 1. The graph to the right shows the motion of an 5 object as...
 x (m) 1. The graph to the right shows the motion of an 5 object as a function of time. How long did it take the object to get from the position x 2.0 m to x 3.0 m? Is there only one correct answer? What is the average velocity for this motion? (If there is more than one, please calculate them all) 0 0 20 40 60 80 100
x (m) 1. The graph to the right shows the motion of an 5 object as...
 x (m) 1. The graph to the right shows the motion of an 5 object as a function of time. How long did it take the object to get from the position x-2.0 m to x-3.0 m? Is there only one correct answer? What is the average velocity for this motion? (If there is more than one, please calculate them all 4 2 0 0 20 40 60 80 100
7:32 0 . 18% 5 Col20628 il y Pow To (a) The graph below plots the...
 7:32 0 . 18% 5 Col20628 il y Pow To (a) The graph below plots the position versus time for an object moving in one dimension along the x direction. What is the speed (magnitude of velocity) of the object at. The graph plots position vs. time, not velocity vs. time. To find velocity, think about the definition of instantaneous velocity and how it is related to position. Notice the graph is a straight line from .. . Can you...
The position vs time of a object is given by 1.What is the y velocity at...
The position vs time of a object is given by 1.What is the y velocity at 4.5 seconds? 2.At what time is the speed equal to 15 m/s? The velocity of an object vs. time is given by 3. What is the acceleration at t = 2s? We were unable to transcribe this imageWe were unable to transcribe this image
6.) Given the following v vs t graph for some object, the object at some velocity...
 6.) Given the following v vs t graph for some object, the object
at some velocity in the +x direction. After 3.8 seconds it stops,
at 7.6 seconds it changes acceleration, and after 10 seconds, it is
stopped again. (Note that from 0 s until 7.6 seconds, the
acceleration is the same.) From 0 until 10 seconds, the average
speed of the object is 28 m/s. What is the acceleration from 0 to
7.6 seconds in m/s2? If in the...
6.) Given the following v vs t graph for some object, the object
at some velocity in the +x direction. After 3.8 seconds it stops,
at 7.6 seconds it changes acceleration, and after 10 seconds, it is
stopped again. (Note that from 0 s until 7.6 seconds, the
acceleration is the same.) From 0 until 10 seconds, the average
speed of the object is 28 m/s. What is the acceleration from 0 to
7.6 seconds in m/s2? If in the...
 The graph below represents the motion of an object moving along a straight line. What was the average speed of the object for the first 6.0 s? 5 velocity (m/s) 0 5 10 15 time (s) 3.0 m/s 3.3 m/s 5.0 m/s O 1.3 m/s 1.8 m/s A woman exerts a constant horizontal force on a large box. As a result, the box moves across a horizontal floor at a constant speed vo. If the woman doubles the constant horizontal...
 The graph below describes the position x vs time of an
object.
Draw as precisely as you can a motion diagram below: (dots,
starting at 0 [m] every 2 seconds)
Draw a graph below it to represent the velocity vs time of the
cart
Position (m) vs time[s] 10 9 CO 7 그림 영역 6 5 4 3 2. 1 0 0 5 10 15 20 25 t a. Draw as precisely as you can a motion diagram below: (dots,...
The graph below describes the position x vs time of an
object.
Draw as precisely as you can a motion diagram below: (dots,
starting at 0 [m] every 2 seconds)
Draw a graph below it to represent the velocity vs time of the
cart
Position (m) vs time[s] 10 9 CO 7 그림 영역 6 5 4 3 2. 1 0 0 5 10 15 20 25 t a. Draw as precisely as you can a motion diagram below: (dots,...
 4. The following graph represents the position of an object, moving along a horizontal line as a function of time. The positive direction is East and negative direction is West. Express all answers to two significant figures. (5 marks) Position Vs. Time 15 10 6 8 10 12 14 16 18 -10 -15 Time, t, (s) a) Over what time interval(s), if any, is the object stopped? b) At what time(s), if any, does the object change direction? c) Determine...
 The following is a position-time graph for an object during a 5.0s time interval Time (s) 8. Which graph of velocity versus time would best represent the object's motion during the same time interval? 띠 Tane n 9. Which graph in diagram 1-36 below represents the motion of an object increasing in velocity? ER) CB) IC) Diegrem 1-36 10. A man walks at a speed of 3.00 m/s for 400 seconds, and then walks at 4.00 m/s for 300 seconds....
 The graph shows the speed of a car traveling in a straight line
as a function of time.
The value of vc is 4.10 m/s and the value of
vd is 7.40 m/s. Calculate the distance traveled by the
car from a time of 2.30 to 6.30 seconds.
Vd Tl 0 2 3 4 5 6 8 1 7 TIme, s
The graph shows the speed of a car traveling in a straight line
as a function of time.
The value of vc is 4.10 m/s and the value of
vd is 7.40 m/s. Calculate the distance traveled by the
car from a time of 2.30 to 6.30 seconds.
Vd Tl 0 2 3 4 5 6 8 1 7 TIme, s
 x (m) 1. The graph to the right shows the motion of an 5 object as a function of time. How long did it take the object to get from the position x 2.0 m to x 3.0 m? Is there only one correct answer? What is the average velocity for this motion? (If there is more than one, please calculate them all) 0 0 20 40 60 80 100
 x (m) 1. The graph to the right shows the motion of an 5 object as a function of time. How long did it take the object to get from the position x-2.0 m to x-3.0 m? Is there only one correct answer? What is the average velocity for this motion? (If there is more than one, please calculate them all 4 2 0 0 20 40 60 80 100
 7:32 0 . 18% 5 Col20628 il y Pow To (a) The graph below plots the position versus time for an object moving in one dimension along the x direction. What is the speed (magnitude of velocity) of the object at. The graph plots position vs. time, not velocity vs. time. To find velocity, think about the definition of instantaneous velocity and how it is related to position. Notice the graph is a straight line from .. . Can you...
 6.) Given the following v vs t graph for some object, the object
at some velocity in the +x direction. After 3.8 seconds it stops,
at 7.6 seconds it changes acceleration, and after 10 seconds, it is
stopped again. (Note that from 0 s until 7.6 seconds, the
acceleration is the same.) From 0 until 10 seconds, the average
speed of the object is 28 m/s. What is the acceleration from 0 to
7.6 seconds in m/s2? If in the...
6.) Given the following v vs t graph for some object, the object
at some velocity in the +x direction. After 3.8 seconds it stops,
at 7.6 seconds it changes acceleration, and after 10 seconds, it is
stopped again. (Note that from 0 s until 7.6 seconds, the
acceleration is the same.) From 0 until 10 seconds, the average
speed of the object is 28 m/s. What is the acceleration from 0 to
7.6 seconds in m/s2? If in the...
Most questions answered within 3 hours.
-
Suppose Acap Corporation will pay a dividend of $2.87 per share
at the end of this...
asked 5 minutes ago -
Scientists make earthquake forecasts using data from:
A.
geodesy
B.
seismology
C.
geology
D.
paleoseismology
E....
asked 8 minutes ago -
Employee training can
be defined as planned organizational efforts to help employees
learn job-related knowledge, skills,...
asked 1 hour ago -
Which for loop is implemented correctly in Java?
Group of answer choices
for (i = 0...
asked 1 hour ago -
Required information
[The following information applies to the questions
displayed below.]
In 2019, Alliant Corporation acquired...
asked 2 hours ago -
How much must I invest today if I want to withdraw 1/3 of my
original investment...
asked 4 hours ago -
What is meant by a “term premium”?
What can explain such a premium? Is it a...
asked 6 hours ago -
23. Which molecule has only covalent bonds? A. CO2 B. Al2O3 C.
Mg3N2
24. The octet...
asked 6 hours ago -
the
total pressure for a mixture of N2O4 and NO2 is 2.20 atm. If Kp=
7.10...
asked 6 hours ago -
Delaware Corp. prepared a master budget that included $22,385
for direct materials, $28,600 for direct labor,...
asked 6 hours ago -
For pesticide HCB (hexachlorobenzene), its logarithmic partition
coefficient log Kow is 5.6. What would be the...
asked 6 hours ago -
A chemist requires 0.422 mil Na2CO3 for a reaction. How many
grams does this correspond to?
asked 6 hours ago