
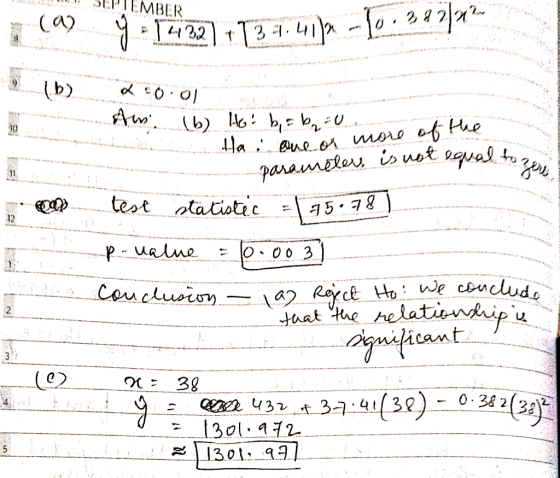
Find the value of the test statistic. (Round your answer to two decimal places.) Find the p-value. (Round your answer to three decimal places.) p-value= What is your conclusion? Reject H. We conclude that the relationship is significant Reject H We cannot conclude that the relationship is significant. Do not reject Ho. We cannot conclude that the relationship is significant. Do not reject H. We conclude that the relationship is significant. (c) Base on the model predict the traffic flow in vehicles per hour at a speed of 38 miles per hour. (Round your answer to two decimal places.) vehicles per hour
Homework Answers
R codes and output :
x=c(35,40,30,45,50,25)
y=c(1257,1327,1226,1333,1350,1122)
z=x*x
f=lm(y~x+z)
summary(f)

Our answer based on the output :
Add Answer to:
A statistical program is recommended. A highway department is studying the relationship between traffic flow and...
A highway department is studying the relationship between traffic flow and speed. The following model has...
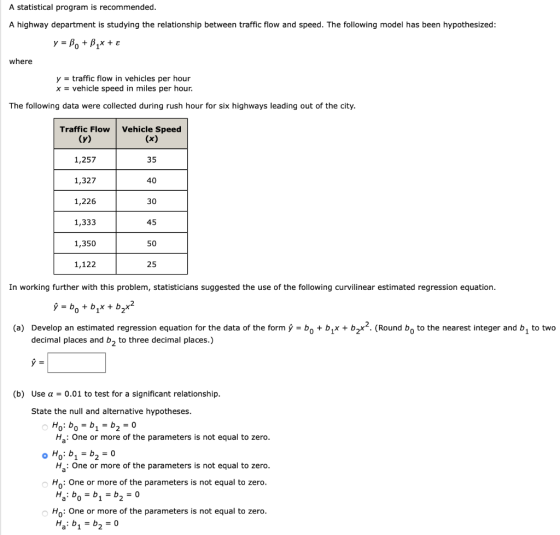
A highway department is studying the relationship between traffic flow and speed. The following model has been hypothesized: y = β0 + β1x + ε where y = traffic flow in vehicles per hour x = vehicle speed in miles per hour. The following data were collected during rush hour for six highways leading out of the city. Traffic Flow (y) Vehicle Speed (x) 1,257 35 1,327 40 1,226 30 1,333 45 1,350 50 1,122 25 In working further with...
A highway department is studying the relationship between traffic flow and speed. The following m...
 A highway department is studying the relationship between traffic flow and speed. The following model has been hypothesized where y traffic flow in vehicles per hour x vehicle speed in miles per hour The following data were collected during rush hour for six highways leading out of the city Traffic Flow (y) 1,256 1,330 1,226 1,335 1,350 1,125 Vehicle Speed (x) 35 35 50 25 Enter negative values as negative, if necessary a. Show the estimated regression equation (to 3...
A highway department is studying the relationship between traffic flow and speed. The following model has...
 A highway department is studying the relationship between traffic flow and speed. The following model has been hypothesized where ytraffic flow in vehicles per hour x vehicle speed in miles per hour The following data were collected during rush hour for six highways leading out of the city Traffic Flow (y) 1306 1398 1240 1154 1445 1227 Vehicle Speed (T) 35 50 35 25 50 30 a. Develop an estimated regression equation for the data The regression equation is: 1...
CENGAGE | MINDTAP Q Search this course Julia Chapter 16 Assignment A highway department is studying...
 CENGAGE | MINDTAP Q Search this course Julia Chapter 16 Assignment A highway department is studying the relationship between traffic flow and speed. The following model has been hypothesized. y = Bo+ B 1x + B 2x2 + € where y = traffic flow in vehicles per hour x = vehicle speed in miles per hour The following data were collected during rush hour for six highways leading out of the city. Traffic Flow (y) Vehicle Speed (x) 1,257 1,329...
DATAnle: Repair A statistical program is recommended. samples 10 W e eported the table Sesw.ved to...
 DATAnle: Repair A statistical program is recommended. samples 10 W e eported the table Sesw.ved to type of repair problem mechanical order , and the pairperson who performed the service. Bata rör Repair Time Months Since in Hours Type of Repair Repairperson Last Service 2.9 Electrical Dave Newton 6 Mechanical Dave Newton 4.8 Electrical Bab Jones 3.0 Mechanical Dave Newton Electrical Dave Newton Electrical 4.2 9 Mechanical Mechanical Bab Jones Bab Jones Bab Jones Electrical Bob Jones Flectrical Dave Newton...
c. Estimate the traffic flow in vehicles per hour at a speed of 39 miles per...
 c. Estimate the traffic flow in vehicles per
hour at a speed of 39 miles per hour (to 2 decimals).
The estimated value is = ____ (to 2 decimals)
99% Confidence interval = ( , ) (to 2 decimals)
99% Prediction interval = ( , ) (to 2 decimals)
A highway department is studying the relationship between traffic flow and speed. The following model has been hypothesized. ŷ = bo + b12+b222 where y=traffic flow in vehicles per hour I...
c. Estimate the traffic flow in vehicles per
hour at a speed of 39 miles per hour (to 2 decimals).
The estimated value is = ____ (to 2 decimals)
99% Confidence interval = ( , ) (to 2 decimals)
99% Prediction interval = ( , ) (to 2 decimals)
A highway department is studying the relationship between traffic flow and speed. The following model has been hypothesized. ŷ = bo + b12+b222 where y=traffic flow in vehicles per hour I...
You may need to use the appropriate technology to answer this question. Consider the following data...
 You may need to use the appropriate technology to answer this question. Consider the following data for a dependent variable y and two independent variables, x, and x, V X1 y 30 92 12 47 10 108 25 17 112 51 16 178 40 5 94 51 19 175 74 7 170 36 12 117 59 13 142 16 210 The estimated regression equation for these data is -18.74 2.01x, 4.73x Here, SST 15,229.6, SSR 14,077.25 0.2495, and 0.9575. (a)...
The National Highway Traffic Safety Administration reported the percentage of traffic accidents occurring each day of...
 The National Highway Traffic Safety Administration reported the percentage of traffic accidents occurring each day of the week. Assume that a sample of 420 accidents provided the following data Sunday Monday Tues day Wednesday Thursday riday Saturday 50 53 47 69 (a) Conduct a hypothesis test to determine if the proportion of traffic accidents is the same for each day of the week. Use a 0.05 level of significance. State the null and alternative hypotheses. Ho: Not all proportions are...
A statistical program is recommended. Data showing the values of several pitching statistics for a random...
A statistical program is recommended. Data showing the values of several pitching statistics for a random sample of 20 pitchers from the American League of Major League Baseball is provided. Player Team W L ERA SO/IP HR/IP R/IP Verlander, J DET 24 5 2.40 1.00 0.10 0.29 Beckett, J BOS 13 7 2.89 0.91 0.11 0.34 Wilson, C TEX 16 7 2.94 0.92 0.07 0.40 Sabathia, C NYY 19 8 3.00 0.97 0.07 0.37 Haren, D LAA 16 10 3.17...
QUESTION THREE On an urban highway, the relationship between vehicle speed and density can be represented...
 QUESTION THREE On an urban highway, the relationship between vehicle speed and density can be represented by the Greenburg Model as the data in Table 3.1. Due to the roadwork on this highway, the width of both traffic lanes is narrowed and a bottleneck to traffic flow forms. The maximum flow on the unobstructed highway is 5000 vehicles per hour whilst on the section under repair the maximum flow is 4000 vehicles per hour. When the traffic flow approaching the...
 A highway department is studying the relationship between traffic flow and speed. The following model has been hypothesized where y traffic flow in vehicles per hour x vehicle speed in miles per hour The following data were collected during rush hour for six highways leading out of the city Traffic Flow (y) 1,256 1,330 1,226 1,335 1,350 1,125 Vehicle Speed (x) 35 35 50 25 Enter negative values as negative, if necessary a. Show the estimated regression equation (to 3...
 A highway department is studying the relationship between traffic flow and speed. The following model has been hypothesized where ytraffic flow in vehicles per hour x vehicle speed in miles per hour The following data were collected during rush hour for six highways leading out of the city Traffic Flow (y) 1306 1398 1240 1154 1445 1227 Vehicle Speed (T) 35 50 35 25 50 30 a. Develop an estimated regression equation for the data The regression equation is: 1...
 CENGAGE | MINDTAP Q Search this course Julia Chapter 16 Assignment A highway department is studying the relationship between traffic flow and speed. The following model has been hypothesized. y = Bo+ B 1x + B 2x2 + € where y = traffic flow in vehicles per hour x = vehicle speed in miles per hour The following data were collected during rush hour for six highways leading out of the city. Traffic Flow (y) Vehicle Speed (x) 1,257 1,329...
 DATAnle: Repair A statistical program is recommended. samples 10 W e eported the table Sesw.ved to type of repair problem mechanical order , and the pairperson who performed the service. Bata rör Repair Time Months Since in Hours Type of Repair Repairperson Last Service 2.9 Electrical Dave Newton 6 Mechanical Dave Newton 4.8 Electrical Bab Jones 3.0 Mechanical Dave Newton Electrical Dave Newton Electrical 4.2 9 Mechanical Mechanical Bab Jones Bab Jones Bab Jones Electrical Bob Jones Flectrical Dave Newton...
 c. Estimate the traffic flow in vehicles per
hour at a speed of 39 miles per hour (to 2 decimals).
The estimated value is = ____ (to 2 decimals)
99% Confidence interval = ( , ) (to 2 decimals)
99% Prediction interval = ( , ) (to 2 decimals)
A highway department is studying the relationship between traffic flow and speed. The following model has been hypothesized. ŷ = bo + b12+b222 where y=traffic flow in vehicles per hour I...
c. Estimate the traffic flow in vehicles per
hour at a speed of 39 miles per hour (to 2 decimals).
The estimated value is = ____ (to 2 decimals)
99% Confidence interval = ( , ) (to 2 decimals)
99% Prediction interval = ( , ) (to 2 decimals)
A highway department is studying the relationship between traffic flow and speed. The following model has been hypothesized. ŷ = bo + b12+b222 where y=traffic flow in vehicles per hour I...
 You may need to use the appropriate technology to answer this question. Consider the following data for a dependent variable y and two independent variables, x, and x, V X1 y 30 92 12 47 10 108 25 17 112 51 16 178 40 5 94 51 19 175 74 7 170 36 12 117 59 13 142 16 210 The estimated regression equation for these data is -18.74 2.01x, 4.73x Here, SST 15,229.6, SSR 14,077.25 0.2495, and 0.9575. (a)...
 The National Highway Traffic Safety Administration reported the percentage of traffic accidents occurring each day of the week. Assume that a sample of 420 accidents provided the following data Sunday Monday Tues day Wednesday Thursday riday Saturday 50 53 47 69 (a) Conduct a hypothesis test to determine if the proportion of traffic accidents is the same for each day of the week. Use a 0.05 level of significance. State the null and alternative hypotheses. Ho: Not all proportions are...
 QUESTION THREE On an urban highway, the relationship between vehicle speed and density can be represented by the Greenburg Model as the data in Table 3.1. Due to the roadwork on this highway, the width of both traffic lanes is narrowed and a bottleneck to traffic flow forms. The maximum flow on the unobstructed highway is 5000 vehicles per hour whilst on the section under repair the maximum flow is 4000 vehicles per hour. When the traffic flow approaching the...
Most questions answered within 3 hours.
-
Define the following concepts in your own words: (a) stiffness,
(b) strength, (c) strain,
(d) ductility,...
asked 4 minutes ago -
In C++
In this homework, you will be tasked with creating functions to
manipulate strings that...
asked 30 minutes ago -
An isolated colony represents a pure culture. one rare occasions
, however , a colony can...
asked 44 minutes ago -
*****DO NOT ANSWER THIS QUESTION IF YOU DON'T
KNOW*******Rights and Duties of Auditors; Minimum 4000
words...
asked 1 hour ago -
The probability that Janie is wearing sunglasses is 1/4. The
probability that she is wearing sunglasses...
asked 2 hours ago -
Do you believe social media is more of a help or a hindrance in
controlling crises...
asked 2 hours ago -
Two long, parallel wires separated by 2.85 cm carry currents in
opposite directions. The current in...
asked 2 hours ago -
Question # 1. Develop a list of rehabilitation journals
that publish articles concerning career counseling for...
asked 2 hours ago -
Bryant Company has a factory machine with a book value of
$85,100 and a remaining useful...
asked 2 hours ago -
What is the default classification for federal tax purposes of a
U.S. eligible entity with one...
asked 2 hours ago -
1. How many grams would 4.0x10²¹ atoms of calcium
weigh?
2.. Calculate the percent oxygen in...
asked 2 hours ago -
Balance Equation
K2Cr2O7 + H2C2O4 2H2O 6 K[Cr(C2O4 )2 (H2O)2 ]2H2O + CO2 +
H2O
asked 2 hours ago