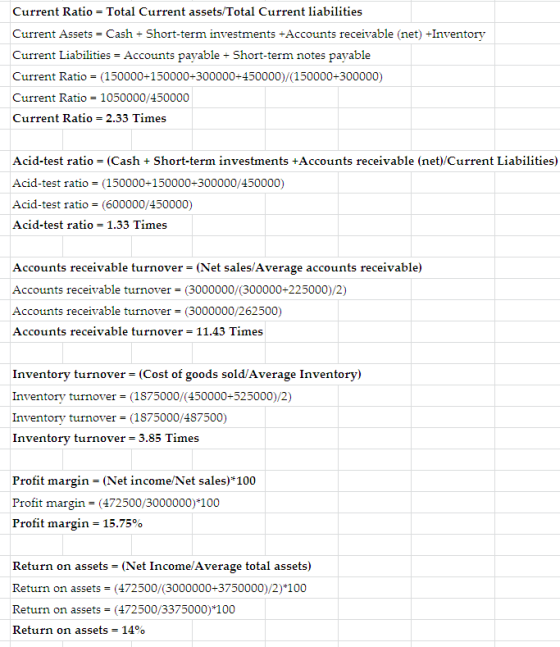
The financial statements of Green Corporation appear below: Green Corporation Comparative Balance Sheets December 31, 2018...
The financial statements of Green Corporation appear below:
Green Corporation
Comparative Balance Sheets
December 31, 2018 - 19
——————————————————————————————————
Assets 2019 2018
Cash $150,000 $ 300,000
Short-term investments 150,000 450,000
Accounts receivable (net) 300,000 225,000
Inventory 450,000 525,000
Property, plant and equipment (net) 1,950,000 2,250,000
Total assets $3,000,000 $3,750,000
Liabilities and stockholders' equity
Accounts payable $150,000 $ 225,000
Short-term notes payable 300,000 675,000
Bonds payable 600,000 1,200,000
Common stock 1,125,000 1,125,000
Retained earnings 825,000 525,000
Total liabilities and stockholders' equity $3,000,000 $3,750,000
Green Corporation
Income Statement
For the Year Ended December 31, 2019
Net sales $3,000,000
Cost of goods sold 1,875,000
Gross profit 1,125,000
Expenses
Operating expenses $315,000
Interest expense 135,000
Total expenses 450,000
Income before income taxes 675,000
Income tax expense 202,500
Net income $ 472,500
.
Required:
(a) Using the financial statements, compute the following ratios for Green Corporation for 2019. Show all computations.
1. Current ratio.
2. Acid-test ratio.
3. Accounts receivable turnover.
4. Inventory turnover.
5. Profit margin.
6. Return on assets.
7. Assets turnover.
8. Times interest earned.
9. Working capital.
10. Debt to assets ratio.
.
(b) Based on the ratios calculated in (a), discuss briefly the improvement or lack thereof in financial position and operating results from 2018 to 2019 of Green Corporation.
Homework Answers
Add Answer to:
The financial statements of Green Corporation appear below:
Green Corporation
Comparative Balance Sheets
December 31, 2018...
Question CAR2: 8 Marks The financial statements of Star Corporation appear below: Star Corporation Comparative Balance...
 Question CAR2: 8 Marks The financial statements of Star Corporation appear below: Star Corporation Comparative Balance Sheets December 31, 2018 - 19 Assets 2019 2018 Cash Short-term investments Accounts receivable (net) Inventory Property, plant and equipment (net) Total assets S 50,000 50,000 100,000 150,000 650.000 $1.000.000 $ 100,000 150,000 75,000 175,000 750,000 $1.250,000 Liabilities and stockholders' equity Accounts payable Short-term notes payable Bonds payable Common stock Retained earnings Total liabilities and stockholders' equity $ 50,000 100,000 200,000 375,000 275.000 $1.000.000...
The financial statements of Hainz Company appear below: HAINZ COMPANY Comparative Balance Sheet December 31 Assets...
 The financial statements of Hainz Company appear below: HAINZ COMPANY Comparative Balance Sheet December 31 Assets 2019 Cash $20,000 Short-term investments 20,000 Accounts receivable (net) 40,000 Inventory 60,000 Property, plant and equipment (net) 260,000 Total assets $400,000 Liabilities and stockholders' equity Accounts payable $20,000 Short-term notes payable 40,000 Bonds payable 80,000 Common stock 150,000 Retained earnings 110,000 Total liabilities and stockholders' equity $400,000 2018 $40,000 60,000 30,000 70,000 300,000 $500,000 $30,000 90,000 160,000 150,000 70,000 $500,000 HAINZ COMPANY Income Statement...
Required: a. Using the financial statements, compute the following ratios for Flowers Co. for 2019. Show...
 Required:
a. Using the financial statements, compute the following ratios
for Flowers Co. for 2019. Show all computations.
(4
marks)
1. Current
ratio.
2. Acid-test ratio.
3. Accounts receivable
turnover.
4. Inventory turnover.
5. Profit
margin.
6. Return on assets.
7. Assets
turnover.
8. Times interest earned.
9. Working capital.
10. Debt to assets ratio.
The financial statements of Flowers Co. appear below: Flowers Co. Comparative Balance Sheets December 31, 2018 - 2019 Assets Caela Short-term investments Accounts receivable...
Required:
a. Using the financial statements, compute the following ratios
for Flowers Co. for 2019. Show all computations.
(4
marks)
1. Current
ratio.
2. Acid-test ratio.
3. Accounts receivable
turnover.
4. Inventory turnover.
5. Profit
margin.
6. Return on assets.
7. Assets
turnover.
8. Times interest earned.
9. Working capital.
10. Debt to assets ratio.
The financial statements of Flowers Co. appear below: Flowers Co. Comparative Balance Sheets December 31, 2018 - 2019 Assets Caela Short-term investments Accounts receivable...
Question: The financial statements of XYZ Company appear below: XYZ COMPANY Comparative Balance Sheet December 31,...
 Question: The financial statements of XYZ Company appear below: XYZ COMPANY Comparative Balance Sheet December 31, Assets Cash .........+4000... Short-term investments. Accounts receivable (net)...-9000 Inventory Property, plant and equipment (net) ........ Total assets ...... 2018 $ 35,000 15,000 50,000 50,000 250.000 $400.000 2017 $ 40,000 60,000 30,000 70,000 300.000 $500.000 Liabilities and stockholders' equity Accounts payable......... $ 10,000 Short-term notes payable ................. 40,000 Bonds payable ...... 88,000 Common stock ............ .....2.1.X 160,000 Retained earnings.- 960.0. 102.000 Total liabilities and stockholders'...
The balance sheets for Plasma Screens Corporation and additional information are provided below PLASMA SCREENS CORPORATION Balance Sheets December 31, 2018 and 2017 2018 2017 Assets Current assets:...
 The balance sheets for Plasma Screens Corporation and additional information are provided below PLASMA SCREENS CORPORATION Balance Sheets December 31, 2018 and 2017 2018 2017 Assets Current assets: Cash Accounts rece Inventory Investments $128,500 76,000 94,000 3,900 119,000 91,000 79,000 1,900 ivable Long-term assets: Land Equipment Less: Accumulated depreciation 470,000 780,000 (418,000) 470,000 660,000 (258,000) $ 1,134,400$ 1,162,900 Total assets Liabilities and Stockholders' Equity Current liabilities Accounts paya Interest payable Income tax payable $98,000 $84,000 11,900 4,900 ble 6,000 8,000...
7. The financial statements of Elcamino Company appear below: ELCAMINO COMPANY Comparative Balance Sheet December 31,...
 7. The financial statements of Elcamino Company appear below: ELCAMINO COMPANY Comparative Balance Sheet December 31, Assets Cash Debt investments Accounts receivable (net) Inventory Property, plant and equipment (net) Total assets $ 2017 $ 25,000 20.000 50,000 140,000 170,000 $405,000 2016 40,000 60,000 30.000 170,000 200,000 $500.000 Liabilities and stockholders equity Accounts payable Short-term notes payable Bonds payable Common stock Retained earnings Total liabilities and stockholders' equity $ 25,000 40,000 75,000 160,000 105.000 S405,000 $ 30,000 90,000 160,000 145,000 75,000...
Financial statements for Franklin Company follow. FRANKLIN COMPANY Balance Sheets As of December 31 2019 2018...
Financial statements for Franklin Company follow. FRANKLIN COMPANY Balance Sheets As of December 31 2019 2018 Assets Current assets Cash $ 19,500 $ 15,500 Marketable securities 20,700 6,700 Accounts receivable (net) 48,000 40,000 Inventories 133,000 141,000 Prepaid items 27,000 12,000 Total current assets 248,200 215,200 Investments 22,000 15,000 Plant (net) 290,000 275,000 Land 33,000 28,000 Total assets $ 593,200 $ 533,200 Liabilities and Stockholders’ Equity Liabilities Current liabilities Notes payable $ 31,200 $ 18,200 Accounts payable 133,800 120,000 Salaries payable...
Financial statements for Vernon Company follow. VERNON COMPANY Balance Sheets As of December 31 2019 2018...
 Financial statements for Vernon Company follow. VERNON COMPANY Balance Sheets As of December 31 2019 2018 $ 24,500 21,700 58,000 143,000 27,000 274,200 32,000 295,000 27,000 $628,200 $ 20,500 7,700 50,000 151,000 12,000 241,200 25,000 280,000 22,000 $568,200 Assets Current assets Cash Marketable securities Accounts receivable (net) Inventories Prepaid items Total current assets Investments Plant (net) Land Total assets Liabilities and Stockholders' Equity Liabilities Current liabilities Notes payable Accounts payable Salaries payable Total current liabilities Noncurrent liabilities Bonds payable Other...
Unit 10 - Financial Statement Analysis Following is a comparative balance sheet for Summer Days Corporation:...
Unit 10 - Financial Statement Analysis Following is a comparative balance sheet for Summer Days Corporation: Summer Days Corporation Comparative Balance Sheet December 31, 2019 and 2018 2019 2018 Current assets: Cash $ 150,000 $ 90,000 Short-term investments 90,000 80,000 Accounts receivable, net 350,000 220,000 Inventory 400,000 430,000 Prepaid expenses 30,000 30,000 Total current assets $1,020,000 $ 850,000 Property, plant, and equipment, net 750,000 500,000 Other assets 280,000 300,000 Total assets $2,050,000 $1,650,000 Current liabilities: Short-term notes payable $650,000 $670,000...
 Question CAR2: 8 Marks The financial statements of Star Corporation appear below: Star Corporation Comparative Balance Sheets December 31, 2018 - 19 Assets 2019 2018 Cash Short-term investments Accounts receivable (net) Inventory Property, plant and equipment (net) Total assets S 50,000 50,000 100,000 150,000 650.000 $1.000.000 $ 100,000 150,000 75,000 175,000 750,000 $1.250,000 Liabilities and stockholders' equity Accounts payable Short-term notes payable Bonds payable Common stock Retained earnings Total liabilities and stockholders' equity $ 50,000 100,000 200,000 375,000 275.000 $1.000.000...
 The financial statements of Hainz Company appear below: HAINZ COMPANY Comparative Balance Sheet December 31 Assets 2019 Cash $20,000 Short-term investments 20,000 Accounts receivable (net) 40,000 Inventory 60,000 Property, plant and equipment (net) 260,000 Total assets $400,000 Liabilities and stockholders' equity Accounts payable $20,000 Short-term notes payable 40,000 Bonds payable 80,000 Common stock 150,000 Retained earnings 110,000 Total liabilities and stockholders' equity $400,000 2018 $40,000 60,000 30,000 70,000 300,000 $500,000 $30,000 90,000 160,000 150,000 70,000 $500,000 HAINZ COMPANY Income Statement...
 Required:
a. Using the financial statements, compute the following ratios
for Flowers Co. for 2019. Show all computations.
(4
marks)
1. Current
ratio.
2. Acid-test ratio.
3. Accounts receivable
turnover.
4. Inventory turnover.
5. Profit
margin.
6. Return on assets.
7. Assets
turnover.
8. Times interest earned.
9. Working capital.
10. Debt to assets ratio.
The financial statements of Flowers Co. appear below: Flowers Co. Comparative Balance Sheets December 31, 2018 - 2019 Assets Caela Short-term investments Accounts receivable...
Required:
a. Using the financial statements, compute the following ratios
for Flowers Co. for 2019. Show all computations.
(4
marks)
1. Current
ratio.
2. Acid-test ratio.
3. Accounts receivable
turnover.
4. Inventory turnover.
5. Profit
margin.
6. Return on assets.
7. Assets
turnover.
8. Times interest earned.
9. Working capital.
10. Debt to assets ratio.
The financial statements of Flowers Co. appear below: Flowers Co. Comparative Balance Sheets December 31, 2018 - 2019 Assets Caela Short-term investments Accounts receivable...
 Question: The financial statements of XYZ Company appear below: XYZ COMPANY Comparative Balance Sheet December 31, Assets Cash .........+4000... Short-term investments. Accounts receivable (net)...-9000 Inventory Property, plant and equipment (net) ........ Total assets ...... 2018 $ 35,000 15,000 50,000 50,000 250.000 $400.000 2017 $ 40,000 60,000 30,000 70,000 300.000 $500.000 Liabilities and stockholders' equity Accounts payable......... $ 10,000 Short-term notes payable ................. 40,000 Bonds payable ...... 88,000 Common stock ............ .....2.1.X 160,000 Retained earnings.- 960.0. 102.000 Total liabilities and stockholders'...
 The balance sheets for Plasma Screens Corporation and additional information are provided below PLASMA SCREENS CORPORATION Balance Sheets December 31, 2018 and 2017 2018 2017 Assets Current assets: Cash Accounts rece Inventory Investments $128,500 76,000 94,000 3,900 119,000 91,000 79,000 1,900 ivable Long-term assets: Land Equipment Less: Accumulated depreciation 470,000 780,000 (418,000) 470,000 660,000 (258,000) $ 1,134,400$ 1,162,900 Total assets Liabilities and Stockholders' Equity Current liabilities Accounts paya Interest payable Income tax payable $98,000 $84,000 11,900 4,900 ble 6,000 8,000...
 7. The financial statements of Elcamino Company appear below: ELCAMINO COMPANY Comparative Balance Sheet December 31, Assets Cash Debt investments Accounts receivable (net) Inventory Property, plant and equipment (net) Total assets $ 2017 $ 25,000 20.000 50,000 140,000 170,000 $405,000 2016 40,000 60,000 30.000 170,000 200,000 $500.000 Liabilities and stockholders equity Accounts payable Short-term notes payable Bonds payable Common stock Retained earnings Total liabilities and stockholders' equity $ 25,000 40,000 75,000 160,000 105.000 S405,000 $ 30,000 90,000 160,000 145,000 75,000...
 Financial statements for Vernon Company follow. VERNON COMPANY Balance Sheets As of December 31 2019 2018 $ 24,500 21,700 58,000 143,000 27,000 274,200 32,000 295,000 27,000 $628,200 $ 20,500 7,700 50,000 151,000 12,000 241,200 25,000 280,000 22,000 $568,200 Assets Current assets Cash Marketable securities Accounts receivable (net) Inventories Prepaid items Total current assets Investments Plant (net) Land Total assets Liabilities and Stockholders' Equity Liabilities Current liabilities Notes payable Accounts payable Salaries payable Total current liabilities Noncurrent liabilities Bonds payable Other...
 Financial statements for Vernon Company follow. VERNON COMPANY Balance Sheets As of December 31 2019 2018 $ 24,500 21,700 58,000 143,000 27,000 274,200 32,000 295,000 27,000 $628,200 $ 20,500 7,700 50,000 151,000 12,000 241,200 25,000 280,000 22,000 $568,200 Assets Current assets Cash Marketable securities Accounts receivable (net) Inventories Prepaid items Total current assets Investments Plant (net) Land Total assets Liabilities and Stockholders' Equity Liabilities Current liabilities Notes payable Accounts payable Salaries payable Total current liabilities Noncurrent liabilities Bonds payable Other...
Most questions answered within 3 hours.
-
An MNE is this kind of industry when competition in one country
is essentially independent of...
asked 41 minutes ago -
. For this set of questions, determine what
proportion of a normal distribution is located betweeneach...
asked 1 hour ago -
A college student is employed as a door-to-door newspaper
salesman. Historical data suggests that the student...
asked 2 hours ago -
MATLAB HW 11 problem using Switch Case and Input commands
Write a script file that calculates...
asked 1 hour ago -
Considering gravitational time dilation, calculate the time that
passes in Earth’s surface while 1 hour passes...
asked 2 hours ago -
Minitab Problem: Take the Lake Hume June rainfall data and find
use the processes outlined in...
asked 3 hours ago -
X Company is trying to decide whether to continue using old
equipment to make Product A...
asked 3 hours ago -
IN PYTHON ONLY !! Program 2: Re-work
program #5 (WeeklyHours) from the previous assignment such that...
asked 4 hours ago -
The average length of time between arrivals at a turnpike
toll-booth is 26 seconds. What is...
asked 5 hours ago -
(a) A piston at 6.1 atm contains a gas that occupies a volume of
3.5 L....
asked 6 hours ago -
Please answer true or false. Words
cannot be changed or added in to make it true...
asked 6 hours ago -
An empty test tube weighs 15.923 grams. Then,
MgCl2•6H2O is added into the test tube. After...
asked 6 hours ago