Suppose a Monopsony facing the following labor supply given by curve: L = 4W, where Lis...
Suppose a Monopsony facing the following labor supply given by curve:
L = 4W, where Lis the number of workers and W = hourly wage.
a) Express the hourly wage in terms of the number of workers (L).
b) Provide an expression of total labor cost in terms of the number of workers (L)
c) Express the marginal expense of labor (MEL) in terms of the number of workers.
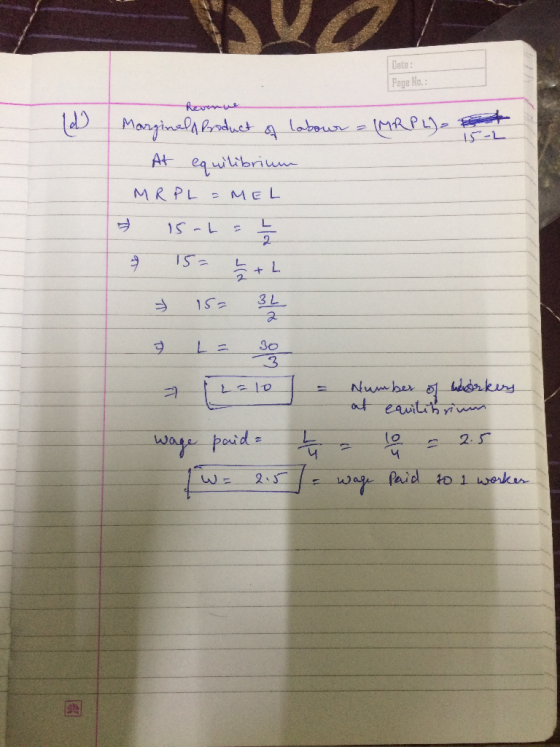
d) Suppose the marginal revenue product of labor ((MRPL) = 15 – L. Find the level of workers and wage paid by monophony the profit maximizing level?
Homework Answers
![Dato: Page No whre L is mbar el workes Lenty wag W terms 1 divid hu To expces hnly wage nucdaen ao] sereirs LL given 24wako b](http://img.homeworklib.com/images/fe9cbf4c-9dba-4ba4-b108-2add31ae6c68.png?x-oss-process=image/resize,w_560)
Add Answer to:
Suppose a Monopsony facing the following labor supply given by
curve:
L = 4W, where Lis...
9. Suppose that a monopsony faces a labor supply curve of Ls-2+2w. What wage does the...
 9. Suppose that a monopsony faces a labor supply curve of Ls-2+2w. What wage does the firm paw if it wants to hire 10 workers? b. What is the marginal expense of hiring an 10 worker? c. Draw a sample (or the exact) Labor Supply curve. Now add in a sample, ME curve and MRP curve such that the equilibrium is at 10 workers and at the wage from part a. Label the equilibrium level of employment and the equilibrium...
Suppose the following table that characterizes the situation of monopsony. a) Complete the table above by...
 Suppose the following table that characterizes the situation of
monopsony.
a) Complete the table above by
computing total and marginal expense of labor for each level of
employment
b) Find the level of employment that
maximizes profit? What wages will the monopsony offered?
c) On the same diagram, draw the
supply curve, marginal expense curve and marginal revenue product
curve.
Total cost Wage Offered Marginal Marginal Number of workers expense revenue Product (МЕ) $10 $11 $12 $13 $14 5 ?...
Suppose the following table that characterizes the situation of
monopsony.
a) Complete the table above by
computing total and marginal expense of labor for each level of
employment
b) Find the level of employment that
maximizes profit? What wages will the monopsony offered?
c) On the same diagram, draw the
supply curve, marginal expense curve and marginal revenue product
curve.
Total cost Wage Offered Marginal Marginal Number of workers expense revenue Product (МЕ) $10 $11 $12 $13 $14 5 ?...
12. If the labor supply curve faced by a monopsony is given by -800 +50W, then...
 12. If the labor supply curve faced by a monopsony is given by -800 +50W, then the correct marginal expenditure curve will be: O w = 16-004 , =-800 + 25 W =-800 + 100w. ︵ w 16-0.021.
15. The following diagram shows the marginal of labor in the production of lemongrass revenue product...
 15. The following diagram shows the marginal of labor in the production of lemongrass revenue product of labor and the supply Wage ($/hour) $42 14 MRPL 56 Quantity of labor Express the marginal revenue product of labor in the lemongrass industry mathematically. a. b. Express the supply of 1abor in the 1emongrass industry mathematically. If lemongrass production were many workers would be hired and what wage would they be paid? competitive in both input and output markets, how C. d....
Labour Demand with Monopsony in the Labour Market and Perfect Competition in the Output Market in...
 Labour Demand with Monopsony in the Labour Market and Perfect Competition in the Output Market in Short Run. Suppose a monopsony has a production function Q = 2L. The firm sells its output in a perfectly competitive market at a price of $200 and its market supply of labor is w=20L. a. Determine the profit-maximizing level of employment and wage offered by the firm. b. Make a diagram. Explain why Marginal Cost of Labour increases at a faster rate than...
What is the equilibrium employment level? Question 2 Consider the following labor market Labor demand: L...
 What is the equilibrium employment level?
Question 2 Consider the following labor market Labor demand: L ap- w Labor supply: LS = as 2w where w is the wage, Lis the number of workers, ap and as are constants a) Suppose that ap 100,000 and as10,000: find the equilibrium employment level L*30,000 L*35,000 L60,000 L70,000
What is the equilibrium employment level?
Question 2 Consider the following labor market Labor demand: L ap- w Labor supply: LS = as 2w where w is the wage, Lis the number of workers, ap and as are constants a) Suppose that ap 100,000 and as10,000: find the equilibrium employment level L*30,000 L*35,000 L60,000 L70,000
3. The supply of labor is given in the following table for Diamond Bakery, which is...
 3. The supply of labor is given in the following table for Diamond Bakery, which is a profit maximizing monopsonist. a) Copy the table below and paste into a word document. Then use the given information to fill in the Total Cost of Labor and the Marginal Expense of Labor. b) According to the table below, how many workers will be hired? What wage will they receive? c) If the government set a $9 minimum wage what would happen to...
1. Welfare loss due to Monopsony Suppose that the supply of Linebackers is given by: w...
 1. Welfare loss due to Monopsony Suppose that the supply of Linebackers is given by: w = $3,000 + 1,000L Where w is the wage and L is the number of Linebackers. Given the supply of Linebackers, the marginal factor cost is MFC = $3,000 + 2,000L The marginal revenue Linebackers of the punter can be expressed as. MRP, = $23,000 - 3,000L (a) Suppose that we are in a competitive market. What is the optimal Linebackers (Lc) that will...
Suppose in a particular labor market, the demand for labor is given by the equation LD...
Suppose in a particular labor market, the demand for labor is given by the equation LD = 120 – 3W and that the labor supply in this market for native-born citizens is given by LN = 3W, while the supply curve of immigrants in this market is given by LI = 2W, where L represents the number of workers, W is the wage expressed in real terms.
6. Suppose that the supply curve for school teachers is Ls 20,000+350W and the 100,000-150W, where...
 6. Suppose that the supply curve for school teachers is Ls 20,000+350W and the 100,000-150W, where L = the number demand curve for school teachers is Ld of teachers and W the daily wage. a. Plot the demand and supply curves. b. What are the equilibrium wage and employment level in this market? .Now suppose that at any given wage 20,000 more workers are willing to work as school teachers. Plot the new supply curve and find the new wage...
 9. Suppose that a monopsony faces a labor supply curve of Ls-2+2w. What wage does the firm paw if it wants to hire 10 workers? b. What is the marginal expense of hiring an 10 worker? c. Draw a sample (or the exact) Labor Supply curve. Now add in a sample, ME curve and MRP curve such that the equilibrium is at 10 workers and at the wage from part a. Label the equilibrium level of employment and the equilibrium...
 Suppose the following table that characterizes the situation of
monopsony.
a) Complete the table above by
computing total and marginal expense of labor for each level of
employment
b) Find the level of employment that
maximizes profit? What wages will the monopsony offered?
c) On the same diagram, draw the
supply curve, marginal expense curve and marginal revenue product
curve.
Total cost Wage Offered Marginal Marginal Number of workers expense revenue Product (МЕ) $10 $11 $12 $13 $14 5 ?...
Suppose the following table that characterizes the situation of
monopsony.
a) Complete the table above by
computing total and marginal expense of labor for each level of
employment
b) Find the level of employment that
maximizes profit? What wages will the monopsony offered?
c) On the same diagram, draw the
supply curve, marginal expense curve and marginal revenue product
curve.
Total cost Wage Offered Marginal Marginal Number of workers expense revenue Product (МЕ) $10 $11 $12 $13 $14 5 ?...
 12. If the labor supply curve faced by a monopsony is given by -800 +50W, then the correct marginal expenditure curve will be: O w = 16-004 , =-800 + 25 W =-800 + 100w. ︵ w 16-0.021.
 15. The following diagram shows the marginal of labor in the production of lemongrass revenue product of labor and the supply Wage ($/hour) $42 14 MRPL 56 Quantity of labor Express the marginal revenue product of labor in the lemongrass industry mathematically. a. b. Express the supply of 1abor in the 1emongrass industry mathematically. If lemongrass production were many workers would be hired and what wage would they be paid? competitive in both input and output markets, how C. d....
 Labour Demand with Monopsony in the Labour Market and Perfect Competition in the Output Market in Short Run. Suppose a monopsony has a production function Q = 2L. The firm sells its output in a perfectly competitive market at a price of $200 and its market supply of labor is w=20L. a. Determine the profit-maximizing level of employment and wage offered by the firm. b. Make a diagram. Explain why Marginal Cost of Labour increases at a faster rate than...
 What is the equilibrium employment level?
Question 2 Consider the following labor market Labor demand: L ap- w Labor supply: LS = as 2w where w is the wage, Lis the number of workers, ap and as are constants a) Suppose that ap 100,000 and as10,000: find the equilibrium employment level L*30,000 L*35,000 L60,000 L70,000
What is the equilibrium employment level?
Question 2 Consider the following labor market Labor demand: L ap- w Labor supply: LS = as 2w where w is the wage, Lis the number of workers, ap and as are constants a) Suppose that ap 100,000 and as10,000: find the equilibrium employment level L*30,000 L*35,000 L60,000 L70,000
 3. The supply of labor is given in the following table for Diamond Bakery, which is a profit maximizing monopsonist. a) Copy the table below and paste into a word document. Then use the given information to fill in the Total Cost of Labor and the Marginal Expense of Labor. b) According to the table below, how many workers will be hired? What wage will they receive? c) If the government set a $9 minimum wage what would happen to...
 1. Welfare loss due to Monopsony Suppose that the supply of Linebackers is given by: w = $3,000 + 1,000L Where w is the wage and L is the number of Linebackers. Given the supply of Linebackers, the marginal factor cost is MFC = $3,000 + 2,000L The marginal revenue Linebackers of the punter can be expressed as. MRP, = $23,000 - 3,000L (a) Suppose that we are in a competitive market. What is the optimal Linebackers (Lc) that will...
 6. Suppose that the supply curve for school teachers is Ls 20,000+350W and the 100,000-150W, where L = the number demand curve for school teachers is Ld of teachers and W the daily wage. a. Plot the demand and supply curves. b. What are the equilibrium wage and employment level in this market? .Now suppose that at any given wage 20,000 more workers are willing to work as school teachers. Plot the new supply curve and find the new wage...
Most questions answered within 3 hours.
-
Write a program to solve the Josephus problem, with the following
modification:
Sample Input:
./a.out n...
asked 1 hour ago -
At the start of a CD it is spinning at a rate of 525 rpm
(revolutions...
asked 1 hour ago -
4. Without doing any calculations, predict whether the observed
∆T would increase, decrease or remain the...
asked 2 hours ago -
Based on the range, which of the following sets of scores has
the greatest variability? 3,...
asked 3 hours ago -
Ripples in a pond travel at a velocity of 3 m/s with one peak
passing a...
asked 3 hours ago -
A man stands on the roof of a building of height 13.0 mm and
throws a...
asked 3 hours ago -
The extent to which assets are financed by borrowed funds and
other liabilities is indicated by:...
asked 4 hours ago -
Explain in detail
Germany is the fifth largest economy
explain what goods and services Germany specializes...
asked 5 hours ago -
The density of platinum is 21.45 g/mL. If a cube of platinum
with a mass of...
asked 5 hours ago -
Accounts Receivable
Sales
A/R Posting
Extended Sales Invoice
Packing Slip
Compare invoice to packing slip 2...
asked 5 hours ago -
Michaella, age 23, is a full-time law student and is claimed by
her parents as a...
asked 5 hours ago -
Why are polymers not typically casted into products?
asked 5 hours ago