Just need the answers please.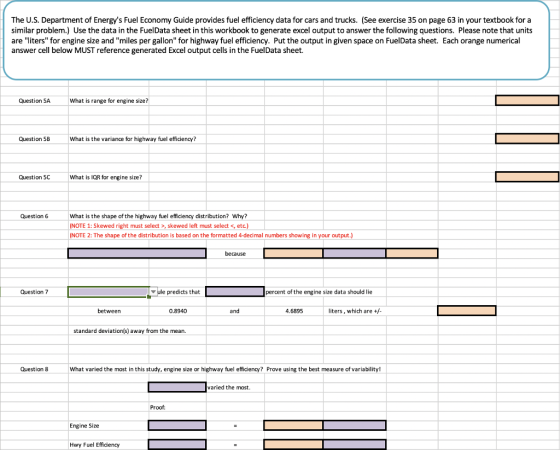
| Engine Size | |
| Mean | 2.7917 |
| Standard Error | 0.0756 |
| Median | 2.7917 |
| Mode | 2.7297 |
| Standard Deviation | 0.6326 |
| Sample Variance | |
| Kurtosis | -0.6958 |
| Skewness | 0.0122 |
| Range | |
| Minimum | 1.6130 |
| Maximum | 4.2186 |
| Sum | |
| Count | 70.0000 |
| Q1 | 2.2954 |
| Q3 | 3.3191 |
| Hwy Fuel Efficiency | |
| Mean | 33.9857 |
| Standard Error | 1.0510 |
| Median | 35.5000 |
| Mode | 46.0000 |
| Standard Deviation | 8.7931 |
| Sample Variance | |
| Kurtosis | -1.3320 |
| Skewness | -0.1543 |
| Range | |
| Minimum | 19.0000 |
| Maximum | 47.0000 |
| Sum | |
| Count | 70.0000 |
| Q1 | 26.0000 |
| Q3 | 42.0000 |
Homework Answers

Add Answer to:
Just need the answers please.
Engine Size
Mean
2.7917
Standard Error
0.0756
Median
2.7917
Mode
2.7297...
I just need help on questions 7 and 8 The U.S. Department of Energy's Fuel Economy...
 I just need help on questions 7 and 8
The U.S. Department of Energy's Fuel Economy Guide provides fuel efficiency data for cars and trucks. (See exercise 35 on page 77 in your textbook for a similar problem.) Use the data in the FuelData sheet in this workbook to generate excel output to answer the following questions. Please note that units are "liters" for engine size and "miles per gallon" for highway fuel efficiency. Put the output in given space...
I just need help on questions 7 and 8
The U.S. Department of Energy's Fuel Economy Guide provides fuel efficiency data for cars and trucks. (See exercise 35 on page 77 in your textbook for a similar problem.) Use the data in the FuelData sheet in this workbook to generate excel output to answer the following questions. Please note that units are "liters" for engine size and "miles per gallon" for highway fuel efficiency. Put the output in given space...
Note: Ahswer Questions S-8 Dy Using the Excel output The U.S. Department of Energy's Fuel Economy...
 Note: Ahswer Questions S-8 Dy Using the Excel output The U.S. Department of Energy's Fuel Economy Guide provides fuel efficiency data for cars and trucks. (See exercise 35 on page 63 in your textbook for a similar problem.) Use the data in the FuelData sheet in this workbook to generate excel output to answer the following questions. Please note that units are "liters" for engine size and "miles per gallon" for highway fuel efficiency. Put the output in given space...
Choose one answer for the purple blanks, answer number for orange blanks Thanks! Place Engine Size...
 Choose one answer for the purple blanks, answer number for
orange blanks
Thanks!
Place Engine Size output (starting with label) in E2 -> EngncSIzC Place Hwy Fuel Eff output (starting with labe) in H2-> Hwy Fuci Effcicncy .155 0.0855 3.1558 .0857 0.7151 Mean -> Mean Standard Error Median Mode Standard Deviation Sample Variance Kurtosis Mcan -> Mean Standard Error Median Mode Standard Deviation Sample Variance Kurtosis Skewness Range Minimum Vlaximium Sum 34.2714 .0863 34.5000 7.0000 9.0888 0.6958 0.0122 1.3757 0.1782...
Choose one answer for the purple blanks, answer number for
orange blanks
Thanks!
Place Engine Size output (starting with label) in E2 -> EngncSIzC Place Hwy Fuel Eff output (starting with labe) in H2-> Hwy Fuci Effcicncy .155 0.0855 3.1558 .0857 0.7151 Mean -> Mean Standard Error Median Mode Standard Deviation Sample Variance Kurtosis Mcan -> Mean Standard Error Median Mode Standard Deviation Sample Variance Kurtosis Skewness Range Minimum Vlaximium Sum 34.2714 .0863 34.5000 7.0000 9.0888 0.6958 0.0122 1.3757 0.1782...
19 ERA 20 Win% 21 0.021 0.028 0.028 0.530 0.038 0.432 0.03 0.022 0.026 0.554 0.028...
 19 ERA 20 Win% 21 0.021 0.028 0.028 0.530 0.038 0.432 0.03 0.022 0.026 0.554 0.028 0.542 0.570 0.620 0.740 0.504 Compute the IQR for ERA. 23 24 25 26 27 28 29 30 31 32 Question 1A Question 1B Compute the covariance between ERA and win%. Question 1C Compute the correlation between ERA and win96. 34 36 Professor Smith took a sample of 211 students from her morning class and a sample of 160 students from her evening class....
$. % , 117 Format as Table. Cell styles Clipboard Font Alignment Number Styles L73 59...
 $. % , 117 Format as Table. Cell styles Clipboard Font Alignment Number Styles L73 59 The U.s. Department of Energy's Fuel Economy Guide provides fuel efficiency data for cars and trucks. (See exercise 35 on page 63 in 70 your textbook for a similar problem.) Use the data in the FuelData sheet in this workbook to generate excel output to answer the 71following questions. Please note that units are "liters" for engine size and "miles per gallon" for highway...
Using Excel, calculate the mean, standard deviation, standard error, median, sample variance, kurtosis, skewness, range, minimum,...
Using Excel, calculate the mean, standard deviation, standard error, median, sample variance, kurtosis, skewness, range, minimum, maximum, sum, count, largest(1), smaller(1) of your distribution and interpret their meanings. Column Mean Standard error Median Mode Standard Deviation Sample variance Kurtosis Skewness Range Minimum Maximum Sum Count Largest(1) Smallest(1)
149 0.8175 Suppose you analyzed the average monthly credit card bill of Visa credit card custome...
 149 0.8175 Suppose you analyzed the average monthly credit card bill of Visa credit card custome cand customers Sample ri and one with 109 Visa credit card customers Sample #2 Every credit card customer in Sample #1 had a monthly credit card bill of $1,809. Sample #2, on the other hand, had an average monthly credit card bill of $1,879 with a variance of 1,361,788 (S)A2. If you combined these samples into one... Note: Answer Questions 5-8 by Using the...
(1, 1 pt ea) Provide the summary statistics for the following set of numbers below (Note:...
 (1, 1 pt ea) Provide the summary statistics for the following set of numbers below (Note: if the answer is not an integer, you must provide the value to three decimal places)s 21, 24, 24, 29, 24, 28, 13, 16, 40, 33, 22, 20, 23, 19 44.1 u Mean 241 Range2Pop. Variance = Z - Median SOR Pop. standard deviation = Q1 225 Mid-range = 20, S- sample Sample standard deviation Mode = Skewness (population)- Kurtosis (population)- Excess kurtosis (population)-...
please show steps for both Q8 and Q9 QUESTION 8 A company that produces light bulbs...
 please show steps for both Q8 and Q9
QUESTION 8 A company that produces light bulbs wants to test in their new LCD bulb has an average lifespan that exceeds 5000 hours. To support their claim they have collected a random sample of 91 bulbs and found the average lifespan of these 91 bulbs was 5,168 hours. The population standard deviation is known to be 457 hours. The company would like to test their hypothesis using a significance level of...
please show steps for both Q8 and Q9
QUESTION 8 A company that produces light bulbs wants to test in their new LCD bulb has an average lifespan that exceeds 5000 hours. To support their claim they have collected a random sample of 91 bulbs and found the average lifespan of these 91 bulbs was 5,168 hours. The population standard deviation is known to be 457 hours. The company would like to test their hypothesis using a significance level of...
 I just need help on questions 7 and 8
The U.S. Department of Energy's Fuel Economy Guide provides fuel efficiency data for cars and trucks. (See exercise 35 on page 77 in your textbook for a similar problem.) Use the data in the FuelData sheet in this workbook to generate excel output to answer the following questions. Please note that units are "liters" for engine size and "miles per gallon" for highway fuel efficiency. Put the output in given space...
I just need help on questions 7 and 8
The U.S. Department of Energy's Fuel Economy Guide provides fuel efficiency data for cars and trucks. (See exercise 35 on page 77 in your textbook for a similar problem.) Use the data in the FuelData sheet in this workbook to generate excel output to answer the following questions. Please note that units are "liters" for engine size and "miles per gallon" for highway fuel efficiency. Put the output in given space...
 Note: Ahswer Questions S-8 Dy Using the Excel output The U.S. Department of Energy's Fuel Economy Guide provides fuel efficiency data for cars and trucks. (See exercise 35 on page 63 in your textbook for a similar problem.) Use the data in the FuelData sheet in this workbook to generate excel output to answer the following questions. Please note that units are "liters" for engine size and "miles per gallon" for highway fuel efficiency. Put the output in given space...
 Choose one answer for the purple blanks, answer number for
orange blanks
Thanks!
Place Engine Size output (starting with label) in E2 -> EngncSIzC Place Hwy Fuel Eff output (starting with labe) in H2-> Hwy Fuci Effcicncy .155 0.0855 3.1558 .0857 0.7151 Mean -> Mean Standard Error Median Mode Standard Deviation Sample Variance Kurtosis Mcan -> Mean Standard Error Median Mode Standard Deviation Sample Variance Kurtosis Skewness Range Minimum Vlaximium Sum 34.2714 .0863 34.5000 7.0000 9.0888 0.6958 0.0122 1.3757 0.1782...
Choose one answer for the purple blanks, answer number for
orange blanks
Thanks!
Place Engine Size output (starting with label) in E2 -> EngncSIzC Place Hwy Fuel Eff output (starting with labe) in H2-> Hwy Fuci Effcicncy .155 0.0855 3.1558 .0857 0.7151 Mean -> Mean Standard Error Median Mode Standard Deviation Sample Variance Kurtosis Mcan -> Mean Standard Error Median Mode Standard Deviation Sample Variance Kurtosis Skewness Range Minimum Vlaximium Sum 34.2714 .0863 34.5000 7.0000 9.0888 0.6958 0.0122 1.3757 0.1782...
 19 ERA 20 Win% 21 0.021 0.028 0.028 0.530 0.038 0.432 0.03 0.022 0.026 0.554 0.028 0.542 0.570 0.620 0.740 0.504 Compute the IQR for ERA. 23 24 25 26 27 28 29 30 31 32 Question 1A Question 1B Compute the covariance between ERA and win%. Question 1C Compute the correlation between ERA and win96. 34 36 Professor Smith took a sample of 211 students from her morning class and a sample of 160 students from her evening class....
 $. % , 117 Format as Table. Cell styles Clipboard Font Alignment Number Styles L73 59 The U.s. Department of Energy's Fuel Economy Guide provides fuel efficiency data for cars and trucks. (See exercise 35 on page 63 in 70 your textbook for a similar problem.) Use the data in the FuelData sheet in this workbook to generate excel output to answer the 71following questions. Please note that units are "liters" for engine size and "miles per gallon" for highway...
 149 0.8175 Suppose you analyzed the average monthly credit card bill of Visa credit card custome cand customers Sample ri and one with 109 Visa credit card customers Sample #2 Every credit card customer in Sample #1 had a monthly credit card bill of $1,809. Sample #2, on the other hand, had an average monthly credit card bill of $1,879 with a variance of 1,361,788 (S)A2. If you combined these samples into one... Note: Answer Questions 5-8 by Using the...
 (1, 1 pt ea) Provide the summary statistics for the following set of numbers below (Note: if the answer is not an integer, you must provide the value to three decimal places)s 21, 24, 24, 29, 24, 28, 13, 16, 40, 33, 22, 20, 23, 19 44.1 u Mean 241 Range2Pop. Variance = Z - Median SOR Pop. standard deviation = Q1 225 Mid-range = 20, S- sample Sample standard deviation Mode = Skewness (population)- Kurtosis (population)- Excess kurtosis (population)-...
 please show steps for both Q8 and Q9
QUESTION 8 A company that produces light bulbs wants to test in their new LCD bulb has an average lifespan that exceeds 5000 hours. To support their claim they have collected a random sample of 91 bulbs and found the average lifespan of these 91 bulbs was 5,168 hours. The population standard deviation is known to be 457 hours. The company would like to test their hypothesis using a significance level of...
please show steps for both Q8 and Q9
QUESTION 8 A company that produces light bulbs wants to test in their new LCD bulb has an average lifespan that exceeds 5000 hours. To support their claim they have collected a random sample of 91 bulbs and found the average lifespan of these 91 bulbs was 5,168 hours. The population standard deviation is known to be 457 hours. The company would like to test their hypothesis using a significance level of...
Most questions answered within 3 hours.
-
Write a program to solve the Josephus problem, with the following
modification:
Sample Input:
./a.out n...
asked 12 minutes ago -
At the start of a CD it is spinning at a rate of 525 rpm
(revolutions...
asked 48 minutes ago -
4. Without doing any calculations, predict whether the observed
∆T would increase, decrease or remain the...
asked 2 hours ago -
Based on the range, which of the following sets of scores has
the greatest variability? 3,...
asked 3 hours ago -
Ripples in a pond travel at a velocity of 3 m/s with one peak
passing a...
asked 3 hours ago -
A man stands on the roof of a building of height 13.0 mm and
throws a...
asked 3 hours ago -
The extent to which assets are financed by borrowed funds and
other liabilities is indicated by:...
asked 4 hours ago -
Explain in detail
Germany is the fifth largest economy
explain what goods and services Germany specializes...
asked 4 hours ago -
The density of platinum is 21.45 g/mL. If a cube of platinum
with a mass of...
asked 4 hours ago -
Accounts Receivable
Sales
A/R Posting
Extended Sales Invoice
Packing Slip
Compare invoice to packing slip 2...
asked 4 hours ago -
Michaella, age 23, is a full-time law student and is claimed by
her parents as a...
asked 4 hours ago -
Why are polymers not typically casted into products?
asked 4 hours ago