
Homework Answers

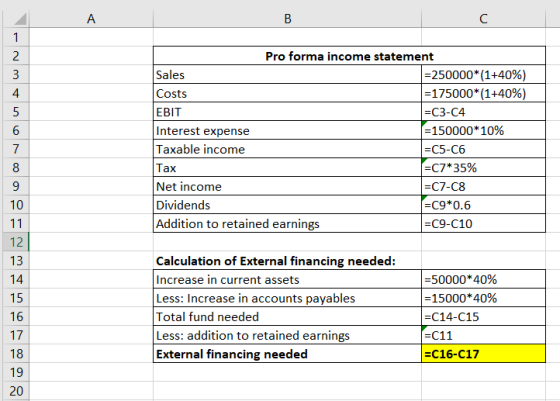
EXCEL FORMULA:
Add Answer to:
Check 1 The 2017 financial statements for Growth Industries are presented below INCOME STATEMENT, 2017 Sales...
ch.18#1 The 2017 financial statements for Growth Industries are presented below. INCOME STATEMENT, 2017 Sales $...
ch.18#1 The 2017 financial statements for Growth Industries are presented below. INCOME STATEMENT, 2017 Sales $ 250,000 Costs 175,000 EBIT $ 75,000 Interest expense 15,000 Taxable income $ 60,000 Taxes (at 35%) 21,000 Net income $ 39,000 Dividends $ 23,400 Addition to retained earnings 15,600 BALANCE SHEET, YEAR-END, 2017 Assets Liabilities Current assets Current liabilities Cash $ 8,000 Accounts payable $ 15,000 Accounts receivable 13,000 Total current liabilities $ 15,000 Inventories 29,000 Long-term debt 150,000 Total current assets $...
The 2019 financial statements for Growth Industries are presented below. INCOME STATEMENT, 2019 Sales $ 250,000...
The 2019 financial statements for Growth Industries are presented below. INCOME STATEMENT, 2019 Sales $ 250,000 Costs 175,000 EBIT $ 75,000 Interest expense 15,000 Taxable income $ 60,000 Taxes (at 21%) 12,600 Net income $ 47,400 Dividends $ 28,440 Addition to retained earnings $ 18,960 BALANCE SHEET, YEAR-END, 2019 Assets Liabilities Current assets Current liabilities Cash $ 8,000 Accounts payable $ 15,000 Accounts receivable 13,000 Total current liabilities $ 15,000 Inventories 29,000 Long-term debt 150,000 Total current assets $...
The 2017 financial statements for Growth Industries are presented below. Sales and costs are proj...
The 2017 financial statements for Growth Industries are presented below. Sales and costs are projected to grow at 30% a year for at least the next 4 years. Both current assets and accounts payable are projected to rise in proportion to sales. The firm is currently operating at 75% capacity, so it plans to increase fixed assets in proportion to sales. Interest expense will equal 10% of long-term debt outstanding at the start of the year. The firm will maintain...
The 2019 financial statements for Growth Industries are presented below. Sales and costs are projected to...
 The 2019 financial statements for Growth Industries are
presented below.
Sales and costs are projected to grow at 30% a year for at least
the next 4 years. Both current assets and accounts payable are
projected to rise in proportion to sales. The firm is currently
operating at 75% capacity, so it plans to increase fixed assets in
proportion to sales. Interest expense will equal 10% of long-term
debt outstanding at the start of the year. The firm will maintain...
The 2019 financial statements for Growth Industries are
presented below.
Sales and costs are projected to grow at 30% a year for at least
the next 4 years. Both current assets and accounts payable are
projected to rise in proportion to sales. The firm is currently
operating at 75% capacity, so it plans to increase fixed assets in
proportion to sales. Interest expense will equal 10% of long-term
debt outstanding at the start of the year. The firm will maintain...
The 2019 financial statements for Growth Industries are presented below. INCOME STATEMENT, 2019 Sales Costs EBIT...
 The 2019 financial statements for Growth Industries are presented below. INCOME STATEMENT, 2019 Sales Costs EBIT Interest expense Taxable income Taxes (at 21%) Net income Dividends $17,380 Addition to retained earnings $17,380 $210,000 155,000 $ 55,000 11,000 $ 44,000 9,240 $ 34,760 Assets Current assets Cash Accounts receivable Inventories Total current assets Net plant and equipment $ 11,000 $ 11,000 110,000 BALANCE SHEET, YEAR-END, 2019 Liabilities Current liabilities $ 4,000 Accounts payable 9,000 Total current liabilities 27,000 Long-term debt $...
The 2019 financial statements for Growth Industries are presented below. INCOME STATEMENT, 2019 Sales $ 360,000...
The 2019 financial statements for Growth Industries are presented below. INCOME STATEMENT, 2019 Sales $ 360,000 Costs 230,000 EBIT $ 130,000 Interest expense 26,000 Taxable income $ 104,000 Taxes (at 21%) 21,840 Net income $ 82,160 Dividends $ 41,080 Addition to retained earnings $ 41,080 BALANCE SHEET, YEAR-END, 2019 Assets Liabilities Current assets Current liabilities Cash $ 5,000 Accounts payable $ 12,000 Accounts receivable 10,000 Total current liabilities $ 12,000 Inventories 35,000 Long-term debt 260,000 Total current assets $...
The 2019 financial statements for Growth Industries are presented below. INCOME STATEMENT, 2019 Sales $ 310,000...
The 2019 financial statements for Growth Industries are presented below. INCOME STATEMENT, 2019 Sales $ 310,000 Costs 205,000 EBIT $ 105,000 Interest expense 21,000 Taxable income $ 84,000 Taxes (at 21%) 17,640 Net income $ 66,360 Dividends $ 26,544 Addition to retained earnings $ 39,816 BALANCE SHEET, YEAR-END, 2019 Assets Liabilities Current assets Current liabilities Cash $ 7,000 Accounts payable $ 14,000 Accounts receivable 12,000 Total current liabilities $ 14,000 Inventories 31,000 Long-term debt 210,000 Total current assets $ 50,000...
The most recent financial statements for Crosby, Inc., follow. Sales for 2018 are projected to grow...
 The most recent financial statements for Crosby, Inc., follow. Sales for 2018 are projected to grow by 25 percent. Interest expense will remain constant; the tax rate and the dividend payout rate will also remain constant. Costs, other expenses, current assets, fixed assets, and accounts payable increase spontaneously with sales. CROSBY, INC. 2017 Income Statement Sales Costs Other expenses $748.000 583,000 19,000 Earnings before interest and taxes Interest paid $ 146,000 15,000 Taxable income Taxes (25%) $ 131,000 32.750 Net...
The most recent financial statements for Scott, Inc., appear below. Sales for 2020 are projected to...
 The most recent financial statements for Scott, Inc., appear
below. Sales for 2020 are projected to grow by 20 percent. Interest
expense will remain constant; the tax rate and the dividend payout
rate also will remain constant. Costs, other expenses, current
assets, fixed assets, and accounts payable increase spontaneously
with sales.
If the firm is operating at full capacity and no new debt or
equity is issued, what external financing is needed to support the
20 percent growth rate in...
The most recent financial statements for Scott, Inc., appear
below. Sales for 2020 are projected to grow by 20 percent. Interest
expense will remain constant; the tax rate and the dividend payout
rate also will remain constant. Costs, other expenses, current
assets, fixed assets, and accounts payable increase spontaneously
with sales.
If the firm is operating at full capacity and no new debt or
equity is issued, what external financing is needed to support the
20 percent growth rate in...
The most recent financial statements for Moose Tours, Inc., appear below. Sales for 2016 are projected...
 The most recent financial statements for Moose Tours, Inc., appear below. Sales for 2016 are projected to grow by 25 percent. Interest expense will remain constant, the tax rate and the dividend payout rate will also remain constant. Costs, other expenses, current assets, fixed assets, and accounts payable increase spontaneously with sales. MOOSE TOURS, INC 2015 Income Statement Sales Costs Other expenses $744,000 579,000 15,000 Earnings before interest and taxes Interest expense $150,000 11,000 Taxable income Taxes (20%) $139,000 27,800...
 The 2019 financial statements for Growth Industries are
presented below.
Sales and costs are projected to grow at 30% a year for at least
the next 4 years. Both current assets and accounts payable are
projected to rise in proportion to sales. The firm is currently
operating at 75% capacity, so it plans to increase fixed assets in
proportion to sales. Interest expense will equal 10% of long-term
debt outstanding at the start of the year. The firm will maintain...
The 2019 financial statements for Growth Industries are
presented below.
Sales and costs are projected to grow at 30% a year for at least
the next 4 years. Both current assets and accounts payable are
projected to rise in proportion to sales. The firm is currently
operating at 75% capacity, so it plans to increase fixed assets in
proportion to sales. Interest expense will equal 10% of long-term
debt outstanding at the start of the year. The firm will maintain...
 The 2019 financial statements for Growth Industries are presented below. INCOME STATEMENT, 2019 Sales Costs EBIT Interest expense Taxable income Taxes (at 21%) Net income Dividends $17,380 Addition to retained earnings $17,380 $210,000 155,000 $ 55,000 11,000 $ 44,000 9,240 $ 34,760 Assets Current assets Cash Accounts receivable Inventories Total current assets Net plant and equipment $ 11,000 $ 11,000 110,000 BALANCE SHEET, YEAR-END, 2019 Liabilities Current liabilities $ 4,000 Accounts payable 9,000 Total current liabilities 27,000 Long-term debt $...
 The most recent financial statements for Crosby, Inc., follow. Sales for 2018 are projected to grow by 25 percent. Interest expense will remain constant; the tax rate and the dividend payout rate will also remain constant. Costs, other expenses, current assets, fixed assets, and accounts payable increase spontaneously with sales. CROSBY, INC. 2017 Income Statement Sales Costs Other expenses $748.000 583,000 19,000 Earnings before interest and taxes Interest paid $ 146,000 15,000 Taxable income Taxes (25%) $ 131,000 32.750 Net...
 The most recent financial statements for Scott, Inc., appear
below. Sales for 2020 are projected to grow by 20 percent. Interest
expense will remain constant; the tax rate and the dividend payout
rate also will remain constant. Costs, other expenses, current
assets, fixed assets, and accounts payable increase spontaneously
with sales.
If the firm is operating at full capacity and no new debt or
equity is issued, what external financing is needed to support the
20 percent growth rate in...
The most recent financial statements for Scott, Inc., appear
below. Sales for 2020 are projected to grow by 20 percent. Interest
expense will remain constant; the tax rate and the dividend payout
rate also will remain constant. Costs, other expenses, current
assets, fixed assets, and accounts payable increase spontaneously
with sales.
If the firm is operating at full capacity and no new debt or
equity is issued, what external financing is needed to support the
20 percent growth rate in...
 The most recent financial statements for Moose Tours, Inc., appear below. Sales for 2016 are projected to grow by 25 percent. Interest expense will remain constant, the tax rate and the dividend payout rate will also remain constant. Costs, other expenses, current assets, fixed assets, and accounts payable increase spontaneously with sales. MOOSE TOURS, INC 2015 Income Statement Sales Costs Other expenses $744,000 579,000 15,000 Earnings before interest and taxes Interest expense $150,000 11,000 Taxable income Taxes (20%) $139,000 27,800...
Most questions answered within 3 hours.
-
An MNE is this kind of industry when competition in one country
is essentially independent of...
asked 1 hour ago -
. For this set of questions, determine what
proportion of a normal distribution is located betweeneach...
asked 1 hour ago -
A college student is employed as a door-to-door newspaper
salesman. Historical data suggests that the student...
asked 2 hours ago -
MATLAB HW 11 problem using Switch Case and Input commands
Write a script file that calculates...
asked 2 hours ago -
Considering gravitational time dilation, calculate the time that
passes in Earth’s surface while 1 hour passes...
asked 3 hours ago -
Minitab Problem: Take the Lake Hume June rainfall data and find
use the processes outlined in...
asked 4 hours ago -
X Company is trying to decide whether to continue using old
equipment to make Product A...
asked 4 hours ago -
IN PYTHON ONLY !! Program 2: Re-work
program #5 (WeeklyHours) from the previous assignment such that...
asked 4 hours ago -
The average length of time between arrivals at a turnpike
toll-booth is 26 seconds. What is...
asked 6 hours ago -
(a) A piston at 6.1 atm contains a gas that occupies a volume of
3.5 L....
asked 7 hours ago -
Please answer true or false. Words
cannot be changed or added in to make it true...
asked 7 hours ago -
An empty test tube weighs 15.923 grams. Then,
MgCl2•6H2O is added into the test tube. After...
asked 7 hours ago