


(b) Here are a few residual plots and some statistical diagnostic test. Discuss the resulting residual analysis. What are your conclusions concerning model adequacy? Residuals ys Fitted Scale-Location .100 0 100 200 308 400 600 .100 100 200 300 400 s Fmed values Fted vaues tCuantles
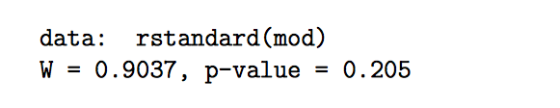
> mod par (mfrow=c(1,3)) > plot (mod,which=c(1,3)) > library(car) > qqPlot (mod) [1] 1 11 > library (1mtest) > resettest (mod) RESET test data: mod RESET 1974.3, dfi 2, df2 7, p-value = 2.331e-10 = = bptest (mod) studentized Breusch-Pagan test data mod BP 1.6445, df 1, p-value 0.1997 = > shapiro.test (rstandard (mod)) Shapiro-Wilk normality test
data W = 0.9037, p-value rstandard (mod) 0.205
Homework Answers
a) from the scatter plot we see that the value of vapor pressure is gradually going higher with increase in temperature. so there exists a positive correlation between them. But in order to justify it by a linear model it will wrong because the plot shows curve not the linearity. So linear regression between vapor pressure and temperature is not adequate.
B)from the 1st plot errors and fitted values are correlated but non linearity exists . so linear regression fails.
from the scale location plot we see that there exists no uniformity in variances throughout our predictor range so heteroscedasticity exists
Add Answer to:
1. Consider data from a study of the association between vapor pressure (in mm and temperature...
DATA Temperature (°C) Temperature (K) /T (K) Vapor Pressure (mm Hg) In (Vapor Pressure) 299.0K 302.2...
 DATA Temperature (°C) Temperature (K) /T (K) Vapor Pressure (mm Hg) In (Vapor Pressure) 299.0K 302.2 K 30% 30q.2K 0.003344 D.003210 o -1 -l -I 149.U |い·3· 1912 0T.2 1. Plot In(Vapor Pressure) vs. 1/T using a spreadsheet program like Excel. Include the correlation coefficient and the lincar regression equation for the best-fit straight line through the points.dsa Attach the graph to this report. I Iniar regresstoneqvation035 Calculate the heat of vaporization for ethanol based on the slope obtained from...
"Vapor Pressure of Water" assignment: VAPOR PRESSURE OF WATER INTRODUCTION All liquids exist in equilibrium with...
 "Vapor Pressure of Water" assignment:
VAPOR PRESSURE OF WATER INTRODUCTION All liquids exist in equilibrium with the vapor state. As temperature increases, this equilibrium shifts more and more in favor of the vapor until one reaches the boiling point, at which all liquid is converted to gas. The pressure exerted by the vapor over the liquid is known as its vapor pressure and is a function of temperature. Boiling occurs at the temperature at which the vapor pressure is equal...
"Vapor Pressure of Water" assignment:
VAPOR PRESSURE OF WATER INTRODUCTION All liquids exist in equilibrium with the vapor state. As temperature increases, this equilibrium shifts more and more in favor of the vapor until one reaches the boiling point, at which all liquid is converted to gas. The pressure exerted by the vapor over the liquid is known as its vapor pressure and is a function of temperature. Boiling occurs at the temperature at which the vapor pressure is equal...
1) The vapor pressure of liquid cobalt is 400. mm Hg at 3.03×10³ K. Assuming that...
1) The vapor pressure of liquid cobalt is 400. mm Hg at 3.03×10³ K. Assuming that ΔHvap for Co (450 kJ/mol) does not change significantly with temperature, calculate the vapor pressure of liquid Co at 3.07×10³ K. 2) The vapor pressure of methyl acetate (CH3COOCH3) has been measured over a range of temperatures. (a) Which of the following should give a linear plot (temperatures in K)? On the x-axis: _____T or lnT or 1/T On the y-axis: _____P or lnP...
2. The vapor pressure, p, of nitric acid varies with temperature as follows: t/°C 0 20...
 2. The vapor pressure, p, of nitric acid varies with temperature as follows: t/°C 0 20 40 50 70 80 90 100 p/kPa 1.92 6.38 17.7 27.7 62.3 89.3 124.9 170.9 Plot and manipulate these data points in excel and answer the following questions. (a) (3 points) What is the boiling point at 100 kPa? How do you get it? (b) (6 points) What is the enthalpy of vaporization of nitric acid? How do you get it?
figure 1 Figure 2 Liquid ethanol mm P increasing P = equilibrium vapor pressure P=0 Add...
 figure 1
Figure 2
Liquid ethanol mm P increasing P = equilibrium vapor pressure P=0 Add System comes to equilibrium ethanol Evacuated flask, pressure zero Molecules begin to vaporize, pressure increases Molecules leave and enter liquid at equal rates, pressure reaches steady-state value 34.6 °C 78.3°C 100 °C Normal boiling point Diethyl ether Vapor pressure (torr) Ethyl alcohol (ethanol) Water Ethylene glycol 100 20 40 60 80 Temperature (°C) Copyright 2009 Pearson Prentice Hall,Inc. Click on: (Figure 2) and study...
figure 1
Figure 2
Liquid ethanol mm P increasing P = equilibrium vapor pressure P=0 Add System comes to equilibrium ethanol Evacuated flask, pressure zero Molecules begin to vaporize, pressure increases Molecules leave and enter liquid at equal rates, pressure reaches steady-state value 34.6 °C 78.3°C 100 °C Normal boiling point Diethyl ether Vapor pressure (torr) Ethyl alcohol (ethanol) Water Ethylene glycol 100 20 40 60 80 Temperature (°C) Copyright 2009 Pearson Prentice Hall,Inc. Click on: (Figure 2) and study...
The following data obtained from a sample gas at given temperature Calculate 1/Volume (1/V) and Pressure...
 The following data obtained from a sample gas at given temperature Calculate 1/Volume (1/V) and Pressure - Volume product (PV) and fill in the table. Plot a graph of Pressure (P) vs 1/Volume (1/V) Using the graph find the Volume of the gas at 1710 mm Hg. Do the Pressure-Volume products follow the Boyle's Law? Explain.
A 10-year study conducted by the American Heart Association provided data on how age, blood pressure,...
A 10-year study conducted by the American Heart Association provided data on how age, blood pressure, and smoking relate to the risk of strokes. Data from a portion of this study follow. Risk is interpreted as the probability (times 100) that a person will have a stroke over the next 10-year period. For the smoker variable, 1 indicates a smoker and 0 indicates a nonsmoker. Risk Age Blood Pressure Smoker 14 58 201 0 23 82 98 1 25 74...
 DATA Temperature (°C) Temperature (K) /T (K) Vapor Pressure (mm Hg) In (Vapor Pressure) 299.0K 302.2 K 30% 30q.2K 0.003344 D.003210 o -1 -l -I 149.U |い·3· 1912 0T.2 1. Plot In(Vapor Pressure) vs. 1/T using a spreadsheet program like Excel. Include the correlation coefficient and the lincar regression equation for the best-fit straight line through the points.dsa Attach the graph to this report. I Iniar regresstoneqvation035 Calculate the heat of vaporization for ethanol based on the slope obtained from...
 "Vapor Pressure of Water" assignment:
VAPOR PRESSURE OF WATER INTRODUCTION All liquids exist in equilibrium with the vapor state. As temperature increases, this equilibrium shifts more and more in favor of the vapor until one reaches the boiling point, at which all liquid is converted to gas. The pressure exerted by the vapor over the liquid is known as its vapor pressure and is a function of temperature. Boiling occurs at the temperature at which the vapor pressure is equal...
"Vapor Pressure of Water" assignment:
VAPOR PRESSURE OF WATER INTRODUCTION All liquids exist in equilibrium with the vapor state. As temperature increases, this equilibrium shifts more and more in favor of the vapor until one reaches the boiling point, at which all liquid is converted to gas. The pressure exerted by the vapor over the liquid is known as its vapor pressure and is a function of temperature. Boiling occurs at the temperature at which the vapor pressure is equal...
 2. The vapor pressure, p, of nitric acid varies with temperature as follows: t/°C 0 20 40 50 70 80 90 100 p/kPa 1.92 6.38 17.7 27.7 62.3 89.3 124.9 170.9 Plot and manipulate these data points in excel and answer the following questions. (a) (3 points) What is the boiling point at 100 kPa? How do you get it? (b) (6 points) What is the enthalpy of vaporization of nitric acid? How do you get it?
 figure 1
Figure 2
Liquid ethanol mm P increasing P = equilibrium vapor pressure P=0 Add System comes to equilibrium ethanol Evacuated flask, pressure zero Molecules begin to vaporize, pressure increases Molecules leave and enter liquid at equal rates, pressure reaches steady-state value 34.6 °C 78.3°C 100 °C Normal boiling point Diethyl ether Vapor pressure (torr) Ethyl alcohol (ethanol) Water Ethylene glycol 100 20 40 60 80 Temperature (°C) Copyright 2009 Pearson Prentice Hall,Inc. Click on: (Figure 2) and study...
figure 1
Figure 2
Liquid ethanol mm P increasing P = equilibrium vapor pressure P=0 Add System comes to equilibrium ethanol Evacuated flask, pressure zero Molecules begin to vaporize, pressure increases Molecules leave and enter liquid at equal rates, pressure reaches steady-state value 34.6 °C 78.3°C 100 °C Normal boiling point Diethyl ether Vapor pressure (torr) Ethyl alcohol (ethanol) Water Ethylene glycol 100 20 40 60 80 Temperature (°C) Copyright 2009 Pearson Prentice Hall,Inc. Click on: (Figure 2) and study...
 The following data obtained from a sample gas at given temperature Calculate 1/Volume (1/V) and Pressure - Volume product (PV) and fill in the table. Plot a graph of Pressure (P) vs 1/Volume (1/V) Using the graph find the Volume of the gas at 1710 mm Hg. Do the Pressure-Volume products follow the Boyle's Law? Explain.
Most questions answered within 3 hours.
-
(63
#14)
which of the following statments best describes how chamging
the concentration of the substances...
asked 2 hours ago -
In the following reaction, which element is undergoing
oxidation: Na2SO3 + N2O --> N2 + Na2SO4...
asked 3 hours ago -
Which of the following pairs of ions have the same electron
configuration?
I: Br− and Se2−...
asked 6 hours ago -
The Foremost Composite Materials Company is planning a two-day
sales conference for October 19-20. The conference...
asked 6 hours ago -
3) Illustrate the observed pattern of relatedness of organisms
versus adaptations to specific conditions. This means...
asked 7 hours ago -
In winter a lake has a 0.35 m thick ice layer over 1.10 m of
water....
asked 7 hours ago -
Assuming the following has been encrypted with a Vigenere cipher
below, use the method(s) and assumptions...
asked 8 hours ago -
How would I use switch statements to write a program that will
take an input of...
asked 8 hours ago -
Imagine a reaction in which methane gas combusts at a constant
pressure of 1 atm and...
asked 8 hours ago -
Two parallel wires (each 12 m in length) are separated by a
distance of 0.065 m...
asked 8 hours ago -
Suppose there were three masses at the corner of uniform
equilateral triangle. The masses are m1...
asked 8 hours ago -
Situation: A building that is 618 m above the ground floor. How
many times would a...
asked 8 hours ago