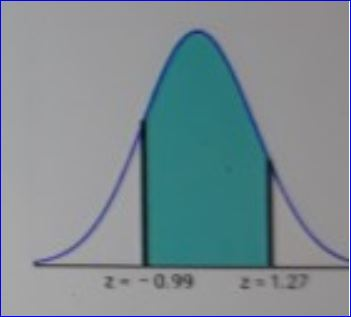
Find the area of the shaded region. The graph depicts the standard normal distribution of bone density scores with mean 0 and standard deviation 1.
Find the area of the shaded region. The graph depicts the standard normal distribution of bone density scores with mean 0 and standard deviation 1.

The area of the shaded region is _______ (Round to four decimal places as needed.)
Homework Answers
Solution:
Given:
We have to find area under curve for shaded region.
that is find:
P( -0.99 < Z < 1.27) =...............?
P( -0.99 < Z < 1.27) =P( Z < 1.27) - P( Z < -0.99 )
Look in z table for z = 1.2 and 0.07 as well as for z = -0.9 and 0.09 and find corresponding area.

P( Z < 1.27) = 0.8980
and

P( Z< -0.99) = 0.1611
Thus
P( -0.99 < Z < 1.27) =P( Z < 1.27) - P( Z < -0.99 )
P( -0.99 < Z < 1.27) =0.8980 - 0.1611
P( -0.99 < Z < 1.27) =0.7369
The area of the shaded region is: 0.7369
Add Answer to:
Find the area of the shaded region. The graph depicts the standard normal distribution of bone density scores with mean 0 and standard deviation 1.
Find the area of the shaded region. The graph depicts the standard normal distribution of bone...
 Find the area of the shaded region. The graph depicts the standard normal distribution of bone density scores with mean and standard deviation 1 The area of the shaded regionis (Round to four decimal places as needed) Find the res of the shaded region. The graph depicts the standard normal distribution of bone density score with mean and standard deviation 1 The area of the shaded region is Round to four decimal places as needed
Find the area of the shaded region. The graph depicts the standard normal distribution of bone...
 Find the area of the shaded region. The graph depicts the standard normal distribution of bone density scores with mean 0 and standard deviation 1. Z= -0.95 The area of the shaded region is _______ (Round to four decimal places as needed.)
Find the area of the shaded region. The graph depicts the standard normal distribution of bone...
 Find the area of the shaded region. The graph depicts the standard normal distribution of bone density scores with mean 0 and standard deviation 1 The area of the shaded region is (Round to four decimal places as needed.) -1 二月
Find the area of the shaded region. The graph depicts the standard normal distribution of bone...
 Find the area of the shaded region. The graph depicts the standard normal distribution of bone density scores with mean 0 and standard deviation 1. 0.39 2 12 The area of the shaded region is (Round to four decimal places as needed.)
Find the area of the shaded region. The graph depicts the standard normal distribution of bone...
 Find the area of the shaded region. The graph depicts the standard normal distribution of bone density scores with mean 0 and standard deviation 1 z=-0.86 z=1.21 The area of the shaded region is □ (Round to four decimal places as needed.)
Find the area of the shaded region. The graph depicts the standard normal distribution of bone...
Find the area of the shaded region. The graph depicts the standard normal distribution of bone density scores with mean 0 and standard deviation 1. z=-096 z=1.26 The area of the shaded region is___? (Round to four decimal places as needed.)
Find the area of the shaded region. The graph depicts the standard normal distribution of bone...
 Find the area of the shaded region. The graph depicts the standard normal distribution of bone density scores with mean 0 and standard deviation 1. € e z= -0.85 z=123 The area of the shaded region is (Round to four decimal places as needed.)
Find the area of the shaded region. The graph depicts the standard normal distribution of bone...
 Find the area of the shaded region. The graph depicts the standard normal distribution of bone density scores with mean 0 and standard deviation 1. The area of the shaded region is (Round to four decimal places as needed.) Enter your answer in the answer box
Find the area of the shaded region. The graph depicts the standard normal distribution of bone...
Find the area of the shaded region. The graph depicts the standard normal distribution of bone density scores with mean 0 and standard deviation 1. z= -0.84 A symmetric bell-shaped curve is plotted over a horizontal scale. A vertical line runs from the scale to the curve at labeled coordinate “z equals negative 0.84,” which is to the left of the curve’s center and peak. The area under the curve to the right of the vertical line is shaded. The...
Find the area of the shaded region. The graph depicts the standard normal distribution of bone...
Find the area of the shaded region. The graph depicts the standard normal distribution of bone density scores with mean 0 and standard deviation 1. z= -0.92 A symmetric bell-shaped curve is plotted over a horizontal scale. A vertical line runs from the scale to the curve at labeled coordinate “z equals negative 0.92,” which is to the left of the curve’s center and peak. The area under the curve to the right of the vertical line is shaded. The...
 Find the area of the shaded region. The graph depicts the standard normal distribution of bone density scores with mean and standard deviation 1 The area of the shaded regionis (Round to four decimal places as needed) Find the res of the shaded region. The graph depicts the standard normal distribution of bone density score with mean and standard deviation 1 The area of the shaded region is Round to four decimal places as needed
 Find the area of the shaded region. The graph depicts the standard normal distribution of bone density scores with mean 0 and standard deviation 1 The area of the shaded region is (Round to four decimal places as needed.) -1 二月
 Find the area of the shaded region. The graph depicts the standard normal distribution of bone density scores with mean 0 and standard deviation 1. 0.39 2 12 The area of the shaded region is (Round to four decimal places as needed.)
 Find the area of the shaded region. The graph depicts the standard normal distribution of bone density scores with mean 0 and standard deviation 1 z=-0.86 z=1.21 The area of the shaded region is □ (Round to four decimal places as needed.)
 Find the area of the shaded region. The graph depicts the standard normal distribution of bone density scores with mean 0 and standard deviation 1. € e z= -0.85 z=123 The area of the shaded region is (Round to four decimal places as needed.)
 Find the area of the shaded region. The graph depicts the standard normal distribution of bone density scores with mean 0 and standard deviation 1. The area of the shaded region is (Round to four decimal places as needed.) Enter your answer in the answer box
Most questions answered within 3 hours.
-
Calculate the pH of a 5.7 M solution of aniline (C6H5NH2; Kb =
3.8 x 10^-10)
asked 1 hour ago -
LSL R3, R3, R12
Memory
Address
Orig.
Data
Updated
Data
Register
Orig.
Data
Updated
Data
0x84F0...
asked 1 hour ago -
Air at 100 kPa and density of 1.2 kg/m3 flows upward through a
5-cm diameter inclined...
asked 1 hour ago -
Define the following concepts in your own words: (a) stiffness,
(b) strength, (c) strain,
(d) ductility,...
asked 2 hours ago -
In C++
In this homework, you will be tasked with creating functions to
manipulate strings that...
asked 2 hours ago -
An isolated colony represents a pure culture. one rare occasions
, however , a colony can...
asked 2 hours ago -
*****DO NOT ANSWER THIS QUESTION IF YOU DON'T
KNOW*******Rights and Duties of Auditors; Minimum 4000
words...
asked 3 hours ago -
The probability that Janie is wearing sunglasses is 1/4. The
probability that she is wearing sunglasses...
asked 4 hours ago -
Do you believe social media is more of a help or a hindrance in
controlling crises...
asked 4 hours ago -
Two long, parallel wires separated by 2.85 cm carry currents in
opposite directions. The current in...
asked 4 hours ago -
Question # 1. Develop a list of rehabilitation journals
that publish articles concerning career counseling for...
asked 4 hours ago -
Bryant Company has a factory machine with a book value of
$85,100 and a remaining useful...
asked 4 hours ago