Describe the short-run aggregate supply (SRAS) curve and the long-run aggregate supply (LRAS) curve. A. the...
Describe the short-run aggregate supply
(SRAS)
curve and the long-run aggregate supply
(LRAS)
curve.
A.
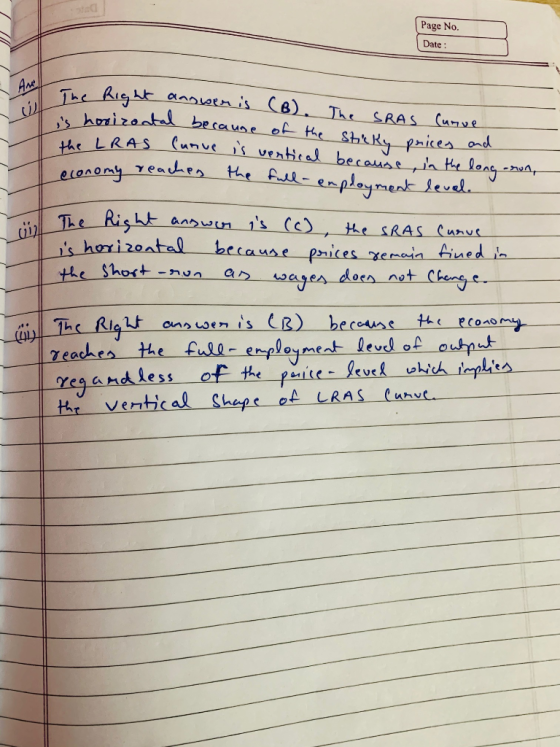
the SRAS curve is horizontal and the LRAS curve is upward sloping
B.
the SRAS curve is horizontal and the LRAS curve is vertical
C.
the SRAS curve is vertical and the LRAS curve is horizontal
D.
the SRAS curve is vertical and the LRAS curve is upward sloping
Why is the short-run aggregate supply curve horizontal?
A.
because output is fixed in the short run
B.
because capital is fixed in the short run
C.
because prices remain fixed in the short run
D.
because the real interest rate is fixed in the short run
Why is the long-run aggregate supply curve vertical?
A.
because the capital stock changes to produce the fixed amount of output in the long run
B.
because the aggregate amount of output supplied is the full-employment level, regardless of the price level
C.
because the price level depends on the amount of output
D.
because prices are fixed in the long run
Homework Answers
Add Answer to:
Describe the short-run aggregate supply
(SRAS)
curve and the long-run aggregate supply
(LRAS)
curve.
A.
the...
Using aggregate demand (AD), short-run aggregate supply (SRAS) and long-run aggregate supply (LRAS) curves
Question 1: AD-SRAS-LRAS Model Using aggregate demand (AD), short-run aggregate supply (SRAS) and long-run aggregate supply (LRAS) curves, graphically illustrate the effect of an increase in the money supply on output and prices in the short and long run. Assume that the economy is initially in long run equilibrium at the potential output level and prices are fixed in the short-run. In your graph, label "A" for the initial equilibrium, "B' for the short-run equilibrium, and "C" for the long-run equilibrium.
Using the aggregate demand (AD), the short-run aggregate supply (SRAS), and the long-run aggregate supply (LRAS)...
Using the aggregate demand (AD), the short-run aggregate supply (SRAS), and the long-run aggregate supply (LRAS) curves, briefly explain how an open market purchase will affect the equilibrium price level (P) and real output (Y) in the short run. Assume the economy is initially in a recession?
What influences the LRAS (long run aggregate supply) and SRAS (short run aggregate supply)? What are...
What influences the LRAS (long run aggregate supply) and SRAS (short run aggregate supply)? What are the three theories that explain the upward slope of the SRAS? How do both monetary and fiscal policy affect the AD?
a) Provide a factor that would shift the long-run aggregate supply (LRAS) curve to the right....
a) Provide a factor that would shift the long-run aggregate supply (LRAS) curve to the right. What does this shift in LRAS imply for aggregate output? Use the Aggregate Demand and Supply model to illustrate this event. Make sure you properly label all the axes and curves. (You only need to draw a shift in LRAS curve, no need to draw other curves). b) Provide a factor that would shift the short-run aggregate supply (SRAS) curve upward (and to the...
24 the changes in prices and output that occur in the long run. changes in wages,...
 24 the changes in prices and output that occur in the long run. changes in wages, and these are unchanged in the long run. the availability and productivity of real resources, not by the output level. b. The shape of the short-run aggregate supply curve is points eBook upsloping, because wages adjust more rapidly than the price level vertical, because wages adjust at the same rate as the price level. upsloping, because wages adjust more slowly than the price level,...
Given a downward-sloping aggregate demand (AD) curve and an upward-sloping short-run aggregate supply curve (SRAS), equilibrium...
Given a downward-sloping aggregate demand (AD) curve and an upward-sloping short-run aggregate supply curve (SRAS), equilibrium occurs where the two intersect. The value on the vertical axis is the equilibrium price level and the value on the horizontal axis is the equilibrium value of real GDP or output. What happens to the economy when AD shifts? It is useful to sketch a graph and show the shift. Suppose, for example, interest rates fall or wealth increases due to a stock...
1. . (Figure: Determining SRAS Shifts) If there are advances in technology, the short-run aggregate supply...
 1.
.
(Figure: Determining SRAS Shifts) If there are advances in
technology, the short-run aggregate supply curve will shift from
SRAS0 to _____ and the price level will shift to
_____.
SRAS1; P0
SRAS2; P2
SRAS2; P1
SRAS1; P1
2.
Simultaneous recession and deflation can be explained by:
a decrease in aggregate supply.
an increase in aggregate supply.
a decrease in aggregate demand.
an increase in aggregate demand.
3.
Which is a determinant of aggregate supply?
household expectations
prices of...
1.
.
(Figure: Determining SRAS Shifts) If there are advances in
technology, the short-run aggregate supply curve will shift from
SRAS0 to _____ and the price level will shift to
_____.
SRAS1; P0
SRAS2; P2
SRAS2; P1
SRAS1; P1
2.
Simultaneous recession and deflation can be explained by:
a decrease in aggregate supply.
an increase in aggregate supply.
a decrease in aggregate demand.
an increase in aggregate demand.
3.
Which is a determinant of aggregate supply?
household expectations
prices of...
The classical dichotomy and monetary neutrality are represented graphically by an upward-sloping short-run aggregate-curve. a vertical long-run aggregate-supply...
The classical dichotomy and monetary neutrality are represented graphically by an upward-sloping short-run aggregate-curve. a vertical long-run aggregate-supply curve. an upward-sloping long-run aggregate-supply curve. a downward-sloping aggregate-demand curve.
The following graph shows the short-run aggregate supply curve (AS), the aggregate demand curve (AD), and the long-run aggregate supply curve (LRAS) for a hypothetical economy
 9. Economic fluctuations II The following graph shows the short-run aggregate supply curve (AS), the aggregate demand curve (AD), and the long-run aggregate supply curve (LRAS) for a hypothetical economy. Initially, the expected price level is equal to the actual price level, and the economy is in long-run equilibrium at its natural level of output, $120 billion. Suppose a bout of severe weather drives up agricultural costs, increases the costs of transporting goods and services, and increases the costs of producing goods...
The aggregate supply curve in the very short run is most likely: 1. Upward-sloping because wages...
The aggregate supply curve in the very short run is most likely: 1. Upward-sloping because wages and prices of other inputs do not fully adjust to changes in the price level. 2. Flat because output can be adjusted to a certain degree without a corresponding change in prices. 3. Vertical because wages and prices of other inputs fully adjust to changes in the price level.
 24 the changes in prices and output that occur in the long run. changes in wages, and these are unchanged in the long run. the availability and productivity of real resources, not by the output level. b. The shape of the short-run aggregate supply curve is points eBook upsloping, because wages adjust more rapidly than the price level vertical, because wages adjust at the same rate as the price level. upsloping, because wages adjust more slowly than the price level,...
 1.
.
(Figure: Determining SRAS Shifts) If there are advances in
technology, the short-run aggregate supply curve will shift from
SRAS0 to _____ and the price level will shift to
_____.
SRAS1; P0
SRAS2; P2
SRAS2; P1
SRAS1; P1
2.
Simultaneous recession and deflation can be explained by:
a decrease in aggregate supply.
an increase in aggregate supply.
a decrease in aggregate demand.
an increase in aggregate demand.
3.
Which is a determinant of aggregate supply?
household expectations
prices of...
1.
.
(Figure: Determining SRAS Shifts) If there are advances in
technology, the short-run aggregate supply curve will shift from
SRAS0 to _____ and the price level will shift to
_____.
SRAS1; P0
SRAS2; P2
SRAS2; P1
SRAS1; P1
2.
Simultaneous recession and deflation can be explained by:
a decrease in aggregate supply.
an increase in aggregate supply.
a decrease in aggregate demand.
an increase in aggregate demand.
3.
Which is a determinant of aggregate supply?
household expectations
prices of...
Most questions answered within 3 hours.
-
How many moles of copper II ion, Cu2+, are present in 200 mL of
a .250...
asked 1 minute ago -
Use the properties of Boolean Algebra to reduce the following
Boolean expression to the simplest form...
asked 2 minutes ago -
This picture is a visual representation of helium. Write the
chemical formula for helium.
asked 4 minutes ago -
1. Sample Mean:
mens- 27.91
women - 31.57
2. Standard Deviation
men- 0.664
women- 1.167
Sample...
asked 14 minutes ago -
Needs Help with Java Programming language!
Lights Camera
Action Purpose: To learn the basics of linked...
asked 12 minutes ago -
Please answer my questions:
True or False and Explain
5)In a perfectly competitive market, if price...
asked 17 minutes ago -
Suppose the interest on a foreign government bonds is 7.5%, and
the current exchange rate is...
asked 19 minutes ago -
Explain why it is important to know common Windows processes
when conducting a forensic investigation
asked 24 minutes ago -
How do child protective services help to reduce the
vulnerability of minors to human trafficking?
asked 31 minutes ago -
Which of the following is correct?
a. ATC = AVC/Q
b. ATC = AFC/Q
c. ATC...
asked 31 minutes ago -
The height of a Harrier airplane above the ground is given by h
= 4.00t 3...
asked 41 minutes ago -
Subject Conflict resolution :
1-Describe the basic model for engaging someone in a
collaborative discussion in...
asked 41 minutes ago