Consider an economy operating below its full-employment output level. The government wants to enact a reduction in income taxes in an effort to restore the economy to full-employment output.
6. Keynesian demand-side versus supply-side effects
Consider an economy operating below its full-employment output level. The government wants to enact a reduction in income taxes in an effort to restore the economy to full-employment output.
On the graph that follows, shift one of the curves to illustrate the impact of the income tax cut on aggregate supply (AS) and aggregate demand (AD) that is emphasized by Keynesian economists.
Note: Select and drag one or both of the curves to the desired position. Curves will snap into position, so if you try to move a curve and it snaps back to its original position, just drag it a little farther.

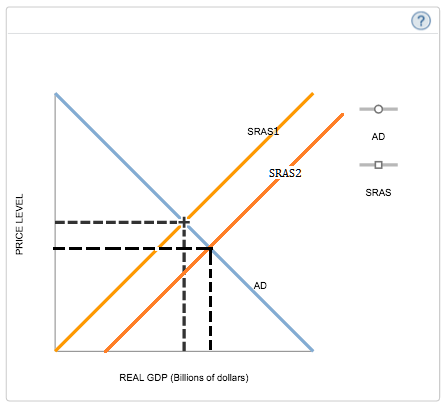
On the graph that follows, shift one of the curves to illustrate the dominant impact of the income tax cut according to supply-side economists.

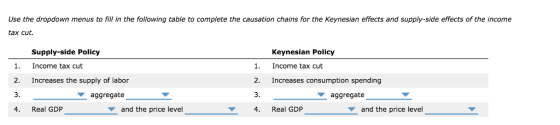
Use the dropdown menus to fill in the following table to complete the causation chains for the Keynesian effects and supply-side effects of the income tax cut.


Homework Answers
The government policy to deliberately influence the aggregate demand in the economy through changes in taxes or government spending or some combination of both is called the discretionary fiscal policy. The fiscal policy that increases aggregate demand by increasing government expenditure or by cutting the taxes or both is called the expansionary fiscal policy. If the policy decreases the aggregate demand by increasing the taxes or decreasing government expenditure, it is called contractionary fiscal policy.
Therefore, decreasing income taxes is expansionary fiscal policy that will increase the aggregate demand in the economy. As aggregate demand increases, given supply, the real GDP and inflation increases at new equilibrium. This is given in the figure below:

The supply side school of economic thought stresses on the importance of aggregate supply to change the output, employment and price level of the economy. The proponents of this school argue that the government should take the fiscal policy that affects the aggregate supply and hence corrects any disequilibrium in the economy. Given the demand a fall in supply means rise in overall prices and decrease in real GDP. Therefore, to combat inflation and increase real GDP at the same time the government should boost aggregate supply. The government can influence the aggregate supply by cutting the tax rate on income, reducing regulations, promoting research and development and subsidies. All of these will increase the workers incentive to work, cut the resource prices and encourage the producers to expand business and production. Thus, as the business expands more people will get job and supply will increase. Given demand this will also decrease the level of prices.

Add Answer to:
Consider an economy operating below its full-employment output level. The government wants to enact a reduction in income taxes in an effort to restore the economy to full-employment output.
The graph shows an economy below full employment. To restore full employment, the government incr...
 The graph shows an economy below full employment. To restore full employment, the government increases government expenditure by $0.5 trillion. Draw a curve to show the effect of the increase if it is the only change in spending plans. Label the curve ADo AE Price level (GDP price index, 2009-100) Potential GDP The increase in government expenditure sets off a multiplier process. Draw a curve that shows the multiplier effect that returns the economy to full employment. Label it AD,...
7. The sources of inflation During World War I and World War II, the U.S. government...
 7. The sources of inflation During World War I and World War II, the U.S. government spent large sums of money on the war effort. Following both of these periods, the United States experienced double-digit inflation. The following graph shows the aggregate demand (AD) and aggregate supply (AS) curves for the United States before the inflationary period. Shift one of the curves on the graph to illustrate the primary cause of the inflation described in the preceding paragraph. Shift one...
6. The long-run effects of monetary policy Aa Aa The following graphs show an economy that is cur...
 6. The long-run effects of monetary policy The following graphs show an economy that is currently in long-run equilibrium. The first graph shows the aggregate demand (AD) and long-run aggregate supply (LRAS) curves. The second shows the long-run (LR) and short-run (SR) Phillips curves. The point on each graph shows the economy's current position. According to the graphs, potential output in this economy is _______ and the natural rate of unemployment is _______ .Suppose the central bank of the economy decreases the...
7. Effects of an active or passive policy
 7. Effects of an active or passive policy The following graph shows the aggregate demand curve (AD), the short-run aggregate supply curve SRAS), and the long-run aggregate supply curve (LRAS) for a hypothetical economy. Suppose the economy is in short-run equilibrium. The _______ of $4 trillion drives unemployment _______ the unemployment rate consistent with full-employment output. Suppose public officials are concerned about the $4 trillion gap in the economy and the resulting lower-than-expected aggregate demand. The government has decided to follow an active...
Economics chart The following graph shows the economy in long-run equilibrium at the price level of...
 Economics chart The following graph shows the economy in long-run equilibrium at the price level of 120 and potential output of $300 billion. Suppose several foreign economies experience severe recessions, causing foreign purchases of domestic goods and services to decline sharply. Shift the short-run aggregate supply (AS) curve or the aggregate demand (AD) curve to show the short-run impact of the economic turmoil abroad. Tool tip: Click and drag one or both of the curves. Curves will snap into position, so if...
The graph shows an economy that is above full employment. To restore full employment, the government...
 The graph shows an economy that is above full employment. To restore full employment, the government decreases government expenditure by $0.5 trillion. Draw a curve to show the effect of the decrease if this is the only change in spending plans. Label the curve AD0-ΔE The decrease in government expenditure sets off a multiplier process. Draw a curve that shows the multiplier effect that returns the economy to full employment. Label it AD Draw a point at the full-employment equilibrium...
6. Monetizing the deficit One of the major objections to government budget deficits is that they...
 6. Monetizing the deficit One of the major objections to government budget deficits is that they may be inflationary. In addition, some worry that the Federal Reserve may monetize part of the deficit by buying some of the newly issued debt, potentially causing even more inflation. In general, a tax cut increases both real GDP and the price level, since it causes aggregate demand to increase. The following graph shows the demand and supply of bank reserves. Show the initial...
The figure below depicts the aggregate demand curve (AD) and the long-run aggregate supply curve (LRAS) for the United States. The economy is initially at long-run equilibrium, at point A.
 The figure below depicts the aggregate demand curve (AD) and the long-run aggregate supply curve (LRAS) for the United States. The economy is initially at long-run equilibrium, at point A.One of the most contentious issues among economists involves the economy’s adjustment to long-run equilibrium. Some economists believe that adjustment can and should occur naturally. This group, the classical economists, stresses the importance of aggregate supply. Others see the return to long-run equilibrium as an adjustment that occurs unpredictably and often...
The full employment output level is the maximum amount of output that the economy can produce...
The full employment output level is the maximum amount of output that the economy can produce when all its resources are fully employed, or its potential output level. The intersection of AD = AS and the vertical line are the same. This intersection of all three curves is the potential real GDP and the natural rate of unemployment. True False An inflationary gap exists when the macro economy is in equilibrium at more than the potential output of the economy...
• if the velocity of money is 2, the money supply in this economy is ($4.5 trillion/ $18 trillion/ $27 trillion/ $3...
 • if the velocity of money is 2, the money supply in this
economy is ($4.5 trillion/ $18 trillion/ $27 trillion/ $36
trillion/ $45trillion /$54 trillion)
•because ( the federal reserve controls M/ velocity is assumed
to be constant/ the AD curve is downward sloping ), the percentage
increase in the price level Is ( less then/ the same as/ greater
then ) the percentage increase im the money supply. the illustrates
the ( importance of the federal reserve /...
• if the velocity of money is 2, the money supply in this
economy is ($4.5 trillion/ $18 trillion/ $27 trillion/ $36
trillion/ $45trillion /$54 trillion)
•because ( the federal reserve controls M/ velocity is assumed
to be constant/ the AD curve is downward sloping ), the percentage
increase in the price level Is ( less then/ the same as/ greater
then ) the percentage increase im the money supply. the illustrates
the ( importance of the federal reserve /...
 The graph shows an economy below full employment. To restore full employment, the government increases government expenditure by $0.5 trillion. Draw a curve to show the effect of the increase if it is the only change in spending plans. Label the curve ADo AE Price level (GDP price index, 2009-100) Potential GDP The increase in government expenditure sets off a multiplier process. Draw a curve that shows the multiplier effect that returns the economy to full employment. Label it AD,...
 7. The sources of inflation During World War I and World War II, the U.S. government spent large sums of money on the war effort. Following both of these periods, the United States experienced double-digit inflation. The following graph shows the aggregate demand (AD) and aggregate supply (AS) curves for the United States before the inflationary period. Shift one of the curves on the graph to illustrate the primary cause of the inflation described in the preceding paragraph. Shift one...
 The graph shows an economy that is above full employment. To restore full employment, the government decreases government expenditure by $0.5 trillion. Draw a curve to show the effect of the decrease if this is the only change in spending plans. Label the curve AD0-ΔE The decrease in government expenditure sets off a multiplier process. Draw a curve that shows the multiplier effect that returns the economy to full employment. Label it AD Draw a point at the full-employment equilibrium...
 6. Monetizing the deficit One of the major objections to government budget deficits is that they may be inflationary. In addition, some worry that the Federal Reserve may monetize part of the deficit by buying some of the newly issued debt, potentially causing even more inflation. In general, a tax cut increases both real GDP and the price level, since it causes aggregate demand to increase. The following graph shows the demand and supply of bank reserves. Show the initial...
 • if the velocity of money is 2, the money supply in this
economy is ($4.5 trillion/ $18 trillion/ $27 trillion/ $36
trillion/ $45trillion /$54 trillion)
•because ( the federal reserve controls M/ velocity is assumed
to be constant/ the AD curve is downward sloping ), the percentage
increase in the price level Is ( less then/ the same as/ greater
then ) the percentage increase im the money supply. the illustrates
the ( importance of the federal reserve /...
• if the velocity of money is 2, the money supply in this
economy is ($4.5 trillion/ $18 trillion/ $27 trillion/ $36
trillion/ $45trillion /$54 trillion)
•because ( the federal reserve controls M/ velocity is assumed
to be constant/ the AD curve is downward sloping ), the percentage
increase in the price level Is ( less then/ the same as/ greater
then ) the percentage increase im the money supply. the illustrates
the ( importance of the federal reserve /...
Most questions answered within 3 hours.
-
Create a separation scheme flow chart/diagram to isolate methyl
salicylate from a product mixture containing the...
asked 14 seconds ago -
5. The animals of which phylum use a water vascular system in
locomotion, feeding and gas...
asked 25 minutes ago -
*HOW DO I CHANGE THIS FROM A VOID FUNCTION TO A NON-VOID
WITH PARAMETERS?*
#include<iostream>
#include<fstream>...
asked 13 minutes ago -
I have a matrix, A= rand(2,3,2) ans(:,:,1) = 0.8116 0.3507
0.8759 0.5328 0.9390 0.5502 ans(:,:,2) =...
asked 17 minutes ago -
A commercial lubricant, Dubdeefordy, has K = SN/SM = 13.1 for
immiscible solvent M and N....
asked 17 minutes ago -
Examine several recent mergers and suggest the principal motives
for merging in each case. Discuss three...
asked 19 minutes ago -
If I want to make 50mL of 5M of NaCl, would I use: 14.6 grams of...
asked 25 minutes ago -
Find the expected value E(X), the variance Var(X) and the
standard deviation σ(X) for each of...
asked 34 minutes ago -
1.Mr. Bill S. Preston, Esq., purchased a new house for $90,000.
He paid $20,000 upfront and...
asked 35 minutes ago -
A resistor connected in parallel with an inductor draws 50mA
from the supply. Calculate the phase...
asked 33 minutes ago -
Typically, state taxable income includes:
a. Apportionable income only.
b. Nonapportionable income only.
c. Both "Apportionable...
asked 41 minutes ago -
A
certain population of children has height thus have a Normal
Distribution with a mean of...
asked 45 minutes ago