Consider the market for designer purses. The following graphshows the demand and supply for designer...
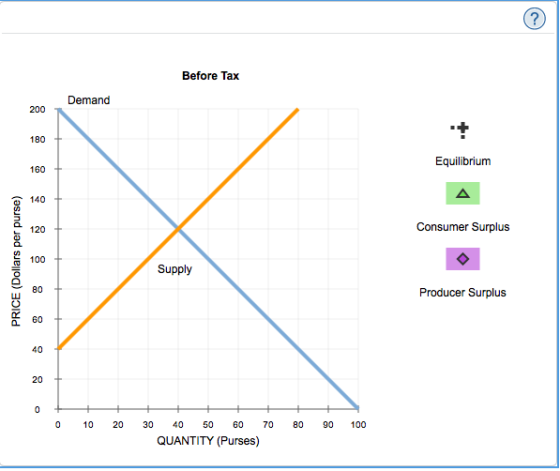
Consider the market for designer purses. The following graph shows the demand and supply for designer purses before the government imposes any taxes.
First, use the black point (plus symbol) to indicate the equilibrium price and quantity of designer purses in the absence of a tax. Then use the green point (triangle symbol) to shade the area representing total consumer surplus (CS) at the equilibrium price. Next, use the purple point (diamond symbol) to shade the area representing total producer surplus (PS) at the equilibrium price.
Suppose the government imposes an excise tax on designer purses. The black line on the following graph shows the tax wedge created by a tax of $40 per purse.
First, use the tan quadrilateral (dash symbols) to shade the area representing tax revenue. Next, use the green point (triangle symbol) to shade the area representing total consumer surplus after the tax. Then, use the purple point (diamond symbol) to shade the area representing total producer surplus after the tax. Finally, use the black point (plus symbol) to shade the area representing deadweight loss.

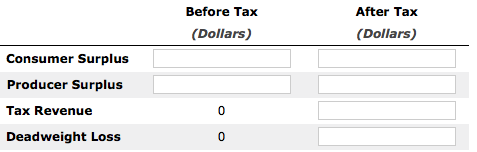
Complete the following table by using the previous graphs to determine the values of consumer and producer surplus before the tax, and consumer surplus, producer surplus, tax revenue, and deadweight loss after the tax.
Note: You can determine the areas of different portions of the graph by selecting the relevant area
.
Homework Answers
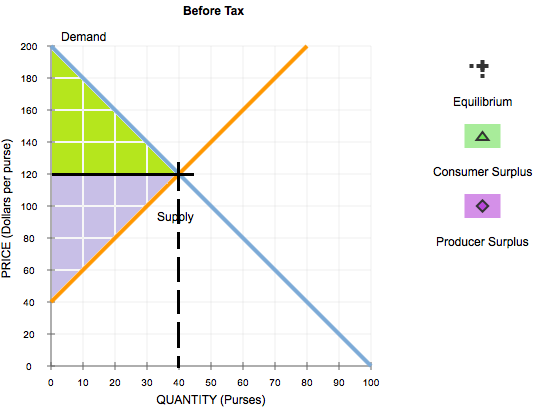

Before Tax; Consumer surplus = 1/2 x base x height = 1/2 x 40 x (200 - 120) = 20 x 80 = $ 1600
Producer surplus = 1/2 x 40 x (120 - 40) = 20 x 80 = $ 1600
After Tax; Consumer surplus = 1/2 x 30 x (200 - 140) = 15 x 60 = 900
Producer surplus = 1/2 x 30 x (100 - 40) = 15 x 60 = 900
Tax revenue = (140 - 100)30 = 40 x 30 = 1200
Deadweight loss = 1/2 x (140 - 100) x (40 - 30) = 20 x 10 = $ 200
Add Answer to:
Consider the market for designer purses. The following graphshows the demand and supply for designer...
Consider the market for designer purses. The following graph shows the demand and supply for designer purses before the government imposes any taxes.
 2. Taxes and welfare Consider the market for designer purses. The following graph shows the demand and supply for designer purses before the government imposes any taxes. First, use the black point (plus symbol) to indicate the equilibrium price and quantity of designer purses in the absence of a tax. Then use the green point (triangle symbol) to shade the area representing total consumer surplus (CS) at the equilibrium price. Next, use the purple point (diamond symbol) to shade the area representing...
2. Taxes and welfare Consider the market for designer purses. The following graph shows the demand...
 2. Taxes and welfare Consider the market for designer purses. The following graph shows the demand and supply for designer purses before the government imposes any taxes. First, use the black point (plus symbol) to indicate the equilibrium price and quantity of designer purses in the absence of a tax. Then use the green point (triangle symbol) to shade the area representing total consumer surplus (CS) at the equilibrium price. Next, use the purple point (diamond symbol) to shade the...
Consider the market for mountain bikes. The following graphshows the demand and supply for mountain...
 Consider the market for mountain bikes. The following graph
shows the demand and supply for mountain bikes before the
government imposes any taxes. First, use the black point (plus
symbol) to indicate the equilibrium price and quantity of mountain
bikes in the absence of a tax. Then use the green point (triangle
symbol) to shade the area representing total consumer surplus (CS)
at the equilibrium price. Next, use the purple point (diamond
symbol) to shade the area representing total producer...
Consider the market for mountain bikes. The following graph
shows the demand and supply for mountain bikes before the
government imposes any taxes. First, use the black point (plus
symbol) to indicate the equilibrium price and quantity of mountain
bikes in the absence of a tax. Then use the green point (triangle
symbol) to shade the area representing total consumer surplus (CS)
at the equilibrium price. Next, use the purple point (diamond
symbol) to shade the area representing total producer...
Consider the market for mountain bikes. The following graph shows the demand and supply for mountain bikes before the government imposes any taxes.
 Consider the market for mountain bikes. The following graph shows the demand and supply for mountain bikes before the government imposes any taxes. First, use the black point (plus symbol) to indicate the equilibrium price and quantity of mountain bikes in the absence of a tax. Then use the green point (triangle symbol) to shade the area representing total consumer surplus (CS) at the equilibrium price. Next, use the purple point (diamond symbol) to shade the area representing total producer surplus...
Consider the market for mountain bikes. The following graph shows the demand and supply for mountain bikes before the govemment imposes any taxes.
 2. Taxes and welfare Consider the market for mountain bikes. The following graph shows the demand and supply for mountain bikes before the govemment imposes any taxes. First, use the black point (plus symbol) to indicate the equilibrium price and quantity of mountain bikes in the absence of a tax. Then use the green point (triangle symbol) to shade the area representing total consumer surplus (CS) at the equilibrium price. Next, use the purple point (diamond symbol) to shade the area representing...
Consider the market for commercial fans. The following graph shows the demand and supply for commercial fans before the government imposes any taxes.
 Consider the market for commercial fans. The following graph shows the demand and supply for commercial fans before the government imposes any taxes. First, use the black point (plus symbol) to indicate the equilibrium price and quantity of commercial fans in the absence of a tax. Then use the green point (triangle symbol) to shade the area representing total consumer surplus (CS) at the equilibrium price. Next, use the purple point (diamond symbol) to shade the area representing total producer surplus...
Consider the market for mountain bikes. The following graph shows the demand and supply for mountain bikes before the government imposes any taxes.
 Consider the market for mountain bikes. The following graph shows the demand and supply for mountain bikes before the government imposes any taxes. First, use tfhe black point (plus symbol) to indicate the equilibrium price and quantity of mountain bikes in the absence of a tax. Then use the green point (triangle symbol) to shade the area representing total consumer surplus (CS) at the equilibrium price. Next, use the purple point (diamond symbol) to shade the area representing total producer surplus...
2. Taxes and welfare Consider the market for commercial fans. The following graph shows the demand...
 2. Taxes and welfare
Consider the market for commercial fans. The following graph
shows the demand and supply for commercial fans before the
government imposes any taxes.
First, use the black point (plus symbol) to indicate the
equilibrium price and quantity of commercial fans in the absence of
a tax. Then use the green point (triangle symbol) to shade the area
representing total consumer surplus (CS) at the equilibrium price.
Next, use the purple point (diamond symbol) to shade the...
2. Taxes and welfare
Consider the market for commercial fans. The following graph
shows the demand and supply for commercial fans before the
government imposes any taxes.
First, use the black point (plus symbol) to indicate the
equilibrium price and quantity of commercial fans in the absence of
a tax. Then use the green point (triangle symbol) to shade the area
representing total consumer surplus (CS) at the equilibrium price.
Next, use the purple point (diamond symbol) to shade the...
 2. Taxes and welfare Consider the market for designer purses. The following graph shows the demand and supply for designer purses before the government imposes any taxes. First, use the black point (plus symbol) to indicate the equilibrium price and quantity of designer purses in the absence of a tax. Then use the green point (triangle symbol) to shade the area representing total consumer surplus (CS) at the equilibrium price. Next, use the purple point (diamond symbol) to shade the...
 2. Taxes and welfare Consider the market for designer purses. The following graph shows the demand and supply for designer purses before the government imposes any taxes. First, use the black point (plus symbol) to indicate the equilibrium price and quantity of designer purses in the absence of a tax. Then use the green point (triangle symbol) to shade the area representing total consumer surplus (CS) at the equilibrium price. Next, use the purple point (diamond symbol) to shade the...
 Consider the market for mountain bikes. The following graph
shows the demand and supply for mountain bikes before the
government imposes any taxes. First, use the black point (plus
symbol) to indicate the equilibrium price and quantity of mountain
bikes in the absence of a tax. Then use the green point (triangle
symbol) to shade the area representing total consumer surplus (CS)
at the equilibrium price. Next, use the purple point (diamond
symbol) to shade the area representing total producer...
Consider the market for mountain bikes. The following graph
shows the demand and supply for mountain bikes before the
government imposes any taxes. First, use the black point (plus
symbol) to indicate the equilibrium price and quantity of mountain
bikes in the absence of a tax. Then use the green point (triangle
symbol) to shade the area representing total consumer surplus (CS)
at the equilibrium price. Next, use the purple point (diamond
symbol) to shade the area representing total producer...
 2. Taxes and welfare
Consider the market for commercial fans. The following graph
shows the demand and supply for commercial fans before the
government imposes any taxes.
First, use the black point (plus symbol) to indicate the
equilibrium price and quantity of commercial fans in the absence of
a tax. Then use the green point (triangle symbol) to shade the area
representing total consumer surplus (CS) at the equilibrium price.
Next, use the purple point (diamond symbol) to shade the...
2. Taxes and welfare
Consider the market for commercial fans. The following graph
shows the demand and supply for commercial fans before the
government imposes any taxes.
First, use the black point (plus symbol) to indicate the
equilibrium price and quantity of commercial fans in the absence of
a tax. Then use the green point (triangle symbol) to shade the area
representing total consumer surplus (CS) at the equilibrium price.
Next, use the purple point (diamond symbol) to shade the...
Most questions answered within 3 hours.
-
Consider a random sample of n independent Xi's that was drawn
from a population with mean...
asked 15 seconds from now -
1.The heights of women aged 20 to 29 follow approximately the
N(64, 2.76) distribution. Men the...
asked 21 minutes ago -
What is the molarity of a solution made up of 82.5g of
Al(NO3)3 in 279 mL...
asked 18 minutes ago -
On an old-fashioned rotating piano stool, a woman sits holding a
pair of dumbbells at a...
asked 5 minutes ago -
Develop (2) criteria for laying off employees while still
practicing ethical and socially responsible leadership, but...
asked 7 minutes ago -
If a dominant firm is charged with refusal to deal under
antitrust law, it is being...
asked 21 minutes ago -
Write a 750 word journal entry in narrative
style about the communications climate and culture in...
asked 12 minutes ago -
4) An astronaut standing at radius R1 on the inner ring of this
space station moves...
asked 18 minutes ago -
The frequency two alleles “A” and “a” is 0.25 and 0.75,
respectively.
a) Assuming H-W equilibrium,...
asked 15 minutes ago -
identify and explain the main four types of financial market.
(20 marks)
asked 23 minutes ago -
The magnetic field 39.0 cm away from a long, straight wire
carrying current 4.00 A is...
asked 24 minutes ago -
This is a question for Toxicology, it asks about the absorbtion,
biotransformation and excretion of a...
asked 26 minutes ago