This chapter analyzed the welfare effects of a tax on a good. Consider now the opposite...
This chapter analyzed the welfare effects of a tax on a good. Consider now the opposite policy. Suppose that the government subsidizes a good. For each unit of the good sold, the government pays $2 to the buyer.
Use the black point (plus symbol) to indicate the initial equilibrium in this market before the subsidy. Then use the green point (triangle symbol) to shade the area representing consumer surplus, and use the purple point (diamond symbol) to shade the area representing producer surplus.

On the following graph, use the tan segment (dash symbols) to indicate the wedge formed between the price received by producers and the price consumers pay out of their own pocket. (Hint: Find the quantity to the right of the initial equilibrium where the difference between the supply and demand curves is $2.) Next use the black point (plus symbol) to indicate the price producers receive at that quantity, and use the grey point (star symbol) to indicate the price consumers pay not including the subsidy. Then use the green triangle (triangle symbols) to indicate consumer surplus the presence of this subsidy, and the purple triangle (diamond symbols) to indicate producer surplus.

Homework Answers
A subsidy is a financial aid given to either for the producer or the consumers, if the subsidy is given to the producer that will decrease the business cost of the firm so the firm has an incentive to produce more at low cost. A subsidy lowers the business cost and increase the production, so the supply curve shifts right. The per unit subsidy is equal to the vertical distance between the new and the old supply curve.

The consumer surplus is the area below the demand curve and above the price line, the producer surplus is the area above the supply curve and below the price line.
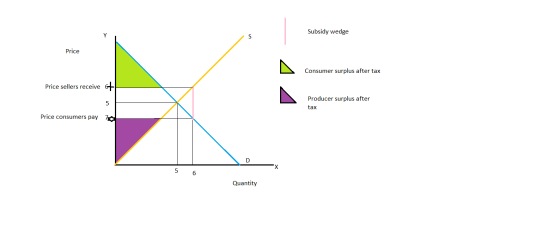
The subsidy increases the price sellers receive and decreases the price that buyers pay.
Add Answer to:
This chapter analyzed the welfare effects of a tax on a good. Consider now the opposite...
2. Taxes and welfare Consider the market for commercial fans. The following graph shows the demand...
 2. Taxes and welfare
Consider the market for commercial fans. The following graph
shows the demand and supply for commercial fans before the
government imposes any taxes.
First, use the black point (plus symbol) to indicate the
equilibrium price and quantity of commercial fans in the absence of
a tax. Then use the green point (triangle symbol) to shade the area
representing total consumer surplus (CS) at the equilibrium price.
Next, use the purple point (diamond symbol) to shade the...
2. Taxes and welfare
Consider the market for commercial fans. The following graph
shows the demand and supply for commercial fans before the
government imposes any taxes.
First, use the black point (plus symbol) to indicate the
equilibrium price and quantity of commercial fans in the absence of
a tax. Then use the green point (triangle symbol) to shade the area
representing total consumer surplus (CS) at the equilibrium price.
Next, use the purple point (diamond symbol) to shade the...
Consider the market for mountain bikes. The following graphshows the demand and supply for mountain...
 Consider the market for mountain bikes. The following graph
shows the demand and supply for mountain bikes before the
government imposes any taxes. First, use the black point (plus
symbol) to indicate the equilibrium price and quantity of mountain
bikes in the absence of a tax. Then use the green point (triangle
symbol) to shade the area representing total consumer surplus (CS)
at the equilibrium price. Next, use the purple point (diamond
symbol) to shade the area representing total producer...
Consider the market for mountain bikes. The following graph
shows the demand and supply for mountain bikes before the
government imposes any taxes. First, use the black point (plus
symbol) to indicate the equilibrium price and quantity of mountain
bikes in the absence of a tax. Then use the green point (triangle
symbol) to shade the area representing total consumer surplus (CS)
at the equilibrium price. Next, use the purple point (diamond
symbol) to shade the area representing total producer...
Consider the market for mountain bikes. The following graph shows the demand and supply for mountain bikes before the government imposes any taxes.
 Consider the market for mountain bikes. The following graph shows the demand and supply for mountain bikes before the government imposes any taxes. First, use tfhe black point (plus symbol) to indicate the equilibrium price and quantity of mountain bikes in the absence of a tax. Then use the green point (triangle symbol) to shade the area representing total consumer surplus (CS) at the equilibrium price. Next, use the purple point (diamond symbol) to shade the area representing total producer surplus...
Consider the market for designer purses. The following graphshows the demand and supply for designer...
 Consider the market for designer purses. The following graph
shows the demand and supply for designer purses before the
government imposes any taxes.First, use the black point (plus symbol) to indicate the
equilibrium price and quantity of designer purses in the absence of
a tax. Then use the green point (triangle symbol) to shade the area
representing total consumer surplus (CS) at the equilibrium price.
Next, use the purple point (diamond symbol) to shade the area
representing total producer surplus...
Consider the market for designer purses. The following graph
shows the demand and supply for designer purses before the
government imposes any taxes.First, use the black point (plus symbol) to indicate the
equilibrium price and quantity of designer purses in the absence of
a tax. Then use the green point (triangle symbol) to shade the area
representing total consumer surplus (CS) at the equilibrium price.
Next, use the purple point (diamond symbol) to shade the area
representing total producer surplus...
Consider the market for mountain bikes. The following graph shows the demand and supply for mountain bikes before the government imposes any taxes.
 Consider the market for mountain bikes. The following graph shows the demand and supply for mountain bikes before the government imposes any taxes. First, use the black point (plus symbol) to indicate the equilibrium price and quantity of mountain bikes in the absence of a tax. Then use the green point (triangle symbol) to shade the area representing total consumer surplus (CS) at the equilibrium price. Next, use the purple point (diamond symbol) to shade the area representing total producer surplus...
Consider the market for designer purses. The following graph shows the demand and supply for designer purses before the government imposes any taxes.
 2. Taxes and welfare Consider the market for designer purses. The following graph shows the demand and supply for designer purses before the government imposes any taxes. First, use the black point (plus symbol) to indicate the equilibrium price and quantity of designer purses in the absence of a tax. Then use the green point (triangle symbol) to shade the area representing total consumer surplus (CS) at the equilibrium price. Next, use the purple point (diamond symbol) to shade the area representing...
Consider the market for commercial fans. The following graph shows the demand and supply for commercial fans before the government imposes any taxes.
 Consider the market for commercial fans. The following graph shows the demand and supply for commercial fans before the government imposes any taxes. First, use the black point (plus symbol) to indicate the equilibrium price and quantity of commercial fans in the absence of a tax. Then use the green point (triangle symbol) to shade the area representing total consumer surplus (CS) at the equilibrium price. Next, use the purple point (diamond symbol) to shade the area representing total producer surplus...
Consider the market for mountain bikes. The following graph shows the demand and supply for mountain bikes before the govemment imposes any taxes.
 2. Taxes and welfare Consider the market for mountain bikes. The following graph shows the demand and supply for mountain bikes before the govemment imposes any taxes. First, use the black point (plus symbol) to indicate the equilibrium price and quantity of mountain bikes in the absence of a tax. Then use the green point (triangle symbol) to shade the area representing total consumer surplus (CS) at the equilibrium price. Next, use the purple point (diamond symbol) to shade the area representing...
2. Taxes and welfare Consider the market for designer purses. The following graph shows the demand...
 2. Taxes and welfare Consider the market for designer purses. The following graph shows the demand and supply for designer purses before the government imposes any taxes. First, use the black point (plus symbol) to indicate the equilibrium price and quantity of designer purses in the absence of a tax. Then use the green point (triangle symbol) to shade the area representing total consumer surplus (CS) at the equilibrium price. Next, use the purple point (diamond symbol) to shade the...
 2. Taxes and welfare
Consider the market for commercial fans. The following graph
shows the demand and supply for commercial fans before the
government imposes any taxes.
First, use the black point (plus symbol) to indicate the
equilibrium price and quantity of commercial fans in the absence of
a tax. Then use the green point (triangle symbol) to shade the area
representing total consumer surplus (CS) at the equilibrium price.
Next, use the purple point (diamond symbol) to shade the...
2. Taxes and welfare
Consider the market for commercial fans. The following graph
shows the demand and supply for commercial fans before the
government imposes any taxes.
First, use the black point (plus symbol) to indicate the
equilibrium price and quantity of commercial fans in the absence of
a tax. Then use the green point (triangle symbol) to shade the area
representing total consumer surplus (CS) at the equilibrium price.
Next, use the purple point (diamond symbol) to shade the...
 Consider the market for mountain bikes. The following graph
shows the demand and supply for mountain bikes before the
government imposes any taxes. First, use the black point (plus
symbol) to indicate the equilibrium price and quantity of mountain
bikes in the absence of a tax. Then use the green point (triangle
symbol) to shade the area representing total consumer surplus (CS)
at the equilibrium price. Next, use the purple point (diamond
symbol) to shade the area representing total producer...
Consider the market for mountain bikes. The following graph
shows the demand and supply for mountain bikes before the
government imposes any taxes. First, use the black point (plus
symbol) to indicate the equilibrium price and quantity of mountain
bikes in the absence of a tax. Then use the green point (triangle
symbol) to shade the area representing total consumer surplus (CS)
at the equilibrium price. Next, use the purple point (diamond
symbol) to shade the area representing total producer...
 Consider the market for designer purses. The following graph
shows the demand and supply for designer purses before the
government imposes any taxes.First, use the black point (plus symbol) to indicate the
equilibrium price and quantity of designer purses in the absence of
a tax. Then use the green point (triangle symbol) to shade the area
representing total consumer surplus (CS) at the equilibrium price.
Next, use the purple point (diamond symbol) to shade the area
representing total producer surplus...
Consider the market for designer purses. The following graph
shows the demand and supply for designer purses before the
government imposes any taxes.First, use the black point (plus symbol) to indicate the
equilibrium price and quantity of designer purses in the absence of
a tax. Then use the green point (triangle symbol) to shade the area
representing total consumer surplus (CS) at the equilibrium price.
Next, use the purple point (diamond symbol) to shade the area
representing total producer surplus...
 2. Taxes and welfare Consider the market for designer purses. The following graph shows the demand and supply for designer purses before the government imposes any taxes. First, use the black point (plus symbol) to indicate the equilibrium price and quantity of designer purses in the absence of a tax. Then use the green point (triangle symbol) to shade the area representing total consumer surplus (CS) at the equilibrium price. Next, use the purple point (diamond symbol) to shade the...
Most questions answered within 3 hours.
-
. For this set of questions, determine what
proportion of a normal distribution is located betweeneach...
asked 28 minutes ago -
A college student is employed as a door-to-door newspaper
salesman. Historical data suggests that the student...
asked 1 hour ago -
MATLAB HW 11 problem using Switch Case and Input commands
Write a script file that calculates...
asked 1 hour ago -
Considering gravitational time dilation, calculate the time that
passes in Earth’s surface while 1 hour passes...
asked 1 hour ago -
Minitab Problem: Take the Lake Hume June rainfall data and find
use the processes outlined in...
asked 2 hours ago -
X Company is trying to decide whether to continue using old
equipment to make Product A...
asked 2 hours ago -
IN PYTHON ONLY !! Program 2: Re-work
program #5 (WeeklyHours) from the previous assignment such that...
asked 3 hours ago -
The average length of time between arrivals at a turnpike
toll-booth is 26 seconds. What is...
asked 4 hours ago -
(a) A piston at 6.1 atm contains a gas that occupies a volume of
3.5 L....
asked 6 hours ago -
Please answer true or false. Words
cannot be changed or added in to make it true...
asked 6 hours ago -
An empty test tube weighs 15.923 grams. Then,
MgCl2•6H2O is added into the test tube. After...
asked 6 hours ago -
Assume memory access is 10 units of time and disk access is
10000 units of time....
asked 6 hours ago