The following data are monthly sales of jeans at a local department store.
4. The following data are monthly sales of jeans at a local department store. The buyer would like to forecast sales of jeans for the next month, July.
(a) Forecast sales of jeans for March through June using the naive method, a two-period moving average, and exponential smoothing with an a = 0.2. (Hint: Use naive to start the exponential smoothing process.)
(b) Compare the forecasts using MAD and decide which is best.
(c) Using your method of choice, make a forecast for the month of July.

10. Rosa's Italian restaurant wants to develop forecasts of daily demand for the next week. The restaurant is closed on Mondays and experiences a seasonal pattern for the other six days of the week. Mario, the manager, has collected information on the number of custom- ers served each day for the past two weeks. If Mario expects total demand for next week to be around 350, what is the forecast for each day of next week?

Homework Answers
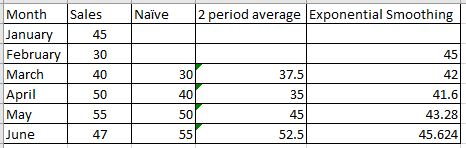
Q4 : In Naive method, the forecast for a period is simply the actual sales of the previous month
Hence Forecast as per Naive method is as below
Forecast for March = 30
Forecast for April = 40
Forecast for May = 50
Forecast for June = 55
In two period moving average the forecast for a period is simply the average of actual sales of previous 2 periods
Hence forecast as per the two period moving average is as below
Forecast for March = (45+30)/2 = 37.5
Forecast for April = (30+40)/2 = 35
Forecast for May = (40+50)/2 = 45
Forecast for June = (50+55)/2 = 52.5
In exponential smoothing method the forecast for a period is given using below formula
Forecast = Forecast for previous period + Smoothing constant (Actual sales of previous period - Forecast for previous period)
Hence forecast as per the exponential smoothing is as per below. The forecast for month of February is taken to be the forecast as per the Naive method which will be 45.
Forecast for March = 45+0.2*(30-45) = 42
Forecast for April = 42+0.2*(40-42) = 41.6
Forecast for May = 41.6+0.2*(50-41.6) = 43.28
Forecast for June = 43.28+0.2*(55-43.28) = 45.624
The results are tabulated below for all three methods
To calculate MAD, we find the absolute difference between the forecast and the actual sales and find its average. Absolute difference is the difference without considering the positive or negative sign
The MAD for different methods are shown in the below image

We can see that the MAD is lowest for Exponential Smoothing. Hence this is the best method.
For July the forecast as per Exponential Smoothing is as below
Forecast for July= 45.624 + 0.2*(47-45.624) = 45.624+0.2*1.376 = 45.8992
Q10 :
The first step is to find the seasonal index for each day. To do this we first find the average sales on each day
Average customers on Tuesday = (52+48)/2 = 100/2 = 50
Average customers on Wednesday = (36+32)/2 = 68/2 = 34
Average customers on Thursday = (35+30)/2 = 65/2 = 32.5
Average customers on Friday = (89+97)/2 = 186/2 = 93
Average customers on Saturday = (98+99)/2 = 197/2 = 98.5
Average customers on Sunday = (65+69)/2 = 134/2 = 67
Average customers across all days = (50+34+32.5+93+98.5+67)/6 = 375/6 = 62.5
Now we find the seasonal index of each day. Seasonal index is calculated by dividing average customers on a particular day by average customers across all days
Seasonal index for Tuesday = 50/62.5 = 0.8
Seasonal index for Wednesday = 34/62.5 = 0.544
Seasonal index for Thursday = 32.5/62.5 = 0.52
Seasonal index for Friday = 93/62.5 = 1.488
Seasonal index for Saturday = 98.5/62.5 = 1.576
Seasonal index for Sunday = 67/62.5 = 1.072
Now we can find the forecast for customers on each day of the next week using the formula below
Forecast for the day = Total Demand Expected/6*Seasonal Index for the day
Forecast for Tuesday = 350/6*0.8 = 46.67  47
47
Forecast for Wednesday = 350/6*0.544 = 31.73 32
Forecast for Thursday = 350/6*0.52 = 30.33 30
Forecast for Friday = 350/6*1.488 = 86.8 87
Forecast for Saturday = 350/6*1.576 = 91.93 92
Forecast for Sunday = 350/6*1.072 = 62.53 63
Add Answer to:
The following data are monthly sales of jeans at a local department store.
2. (20 points) The following table shows the monthly sales in a local grocery store Month and 120 115 125 119 127 114 114 120 124 116 137 10 a. Suppose that Three-weeks moving average are used to...
 2. (20 points) The following table shows the monthly sales in a local grocery store Month and 120 115 125 119 127 114 114 120 124 116 137 10 a. Suppose that Three-weeks moving average are used to forecast sales. Determine the one-step-ahead forecasts for weeks 4 through 10. b. Suppose that exponential smoothing is used with a smoothing constant α-02. Find the exponential smoothing forecasts weeks 4 through 10. (To get the method started, use 120.00 as the forecast...
The following is the data of recent refrigerator sales at a local Home Depot store. Month...
The following is the data of recent refrigerator sales at a local Home Depot store. Month 1 2 3 4 5 Actual Sales 95 100 80 90 ??? Inputs will be exact numbers. What is the forecasted sales in month 5 using naive approach. Please use a 2-month simple moving average method to forecast sales in month 5. Please use a weighted moving average method, with weights of 0.6 one period ago, 0.3 two periods ago, and 0.1 three periods...
A small Italian restaurant wants to forecast pepperoni pizza sales. Actual sales and forecasts for the...
A small Italian restaurant wants to forecast pepperoni pizza sales. Actual sales and forecasts for the past several months are shown below. The owner prefers to use an exponential smoothing forecasting model with αλπηα&νβσπ; = 0.30. What would be the exponential smoothing forecast for June? Period Demand Forecast April 500 480 May 476 June 503
Sales of quilt covers at Bud Banis's discount department store in Carbondale over the past year are shown below
Sales of quilt covers at Bud Banis's discount department store in Carbondale over the past year are shown below. Management prepared a forecast using a combination of exponential smoothing and its collective judgment for the 4 months (March, April, May, and June): MonthJulAugSepOctNovDecJanFebMarAprMayJunUnit Sales98979611012412092831019890110Management's Forecast--------122116110110a) MAD for the forecast developed by the management's technique = _______ sales (round your response to two decimal places).MAPE for the forecast developed by the management's technique = _______ %(round your response to two decimal places).b)...
Consider the following actual and forecast demand levels for Big Mac hamburgers at a local McDonald's...
 Consider the following actual and forecast demand levels for Big
Mac hamburgers at a local McDonald's restaurant:
Day Monday Tuesday Wednesday Thursday Friday Actual Demand 88.00 75.00 70.00 52.00 Forecast Demand 88.00 88.00 84.10 79.87 The forecast for Monday was derived by observing Monday's demand level and setting Monday's forecast level equal to this demand level. Subsequent forecasts were derived by using exponential smoothing with a smoothing constant of 0.30. Using this exponential smoothing method, the forecast for Big Mac...
Consider the following actual and forecast demand levels for Big
Mac hamburgers at a local McDonald's restaurant:
Day Monday Tuesday Wednesday Thursday Friday Actual Demand 88.00 75.00 70.00 52.00 Forecast Demand 88.00 88.00 84.10 79.87 The forecast for Monday was derived by observing Monday's demand level and setting Monday's forecast level equal to this demand level. Subsequent forecasts were derived by using exponential smoothing with a smoothing constant of 0.30. Using this exponential smoothing method, the forecast for Big Mac...
Note: Data for these problems are in the Module 2 Individual Assignments Data file - there is a tab for each problem, A...
 Note: Data for these problems are in the Module 2 Individual Assignments Data file - there is a tab for each problem, All answers should be entered using two decimal places unless otherwise specified. If both decimal places are zeros-then just enter the integer value. Percentages should be entered without"%" sign- 3.45% should be entered as 3.45. M2 IND1. Mariah Henderson is a WCU student who has just finished her junior year. The data in Worksheet IND1 summarizes her grade...
The answer is not the ones marked. Kristen Pacheco owns a small restaurant that's open seven...
 The answer is not the ones marked.
Kristen Pacheco owns a small restaurant that's open seven days a week. Until recently, she forecasted the daily number of customers she would have using her intuition. However, she wanted to open another restaurant and recognized the need to adopt a more formal method of forecasting that could be used in both locations. Kristen decided to compare a three week moving average forecast with exponential smoothing forecasts using a = .7 and a...
The answer is not the ones marked.
Kristen Pacheco owns a small restaurant that's open seven days a week. Until recently, she forecasted the daily number of customers she would have using her intuition. However, she wanted to open another restaurant and recognized the need to adopt a more formal method of forecasting that could be used in both locations. Kristen decided to compare a three week moving average forecast with exponential smoothing forecasts using a = .7 and a...
The monthly sales for Yazici batteries were as follows on January 21, February 20, March 16,...
The monthly sales for Yazici batteries were as follows on January 21, February 20, March 16, April 15.May 15,June 18,July 17,August 18, September 22, October 20, November 21, December 24. forcast for the next month (Jan) using the naive method. The forecast for the next period (Jan) using the 3-month moving approach. Using smoothing with a=0.30 and a September forecast of 18.00 the forecast for the next period (Jan) sales.
The monthly sales for Yazici Batteries, Inc., were as follows:
The monthly sales for Yazici Batteries, Inc., were as follows: Month Jan Feb Mar Apr May Jun Jul Aug Sept Oct Nov DecSales 19 21 17 14 11 18 16 19 20 20 23 23b) The forecast for the next month (Jan) using the naive method (round your response to a whole number)The forecast for the next period (Jan) using a 3-month moving average approach =(round your response to two decimal places)The forecast for the next period (Jan) using a 6-month weighted average with weights ofandwhere the heaviest weights are applied to the most recent month = (round your response to one decimalplace)Using...
excel spreadsheet information: Month Sales (in millions of boxes) 1 1306 2 1305 3 1311 4...
 excel spreadsheet information:
Month
Sales (in millions of boxes)
1
1306
2
1305
3
1311
4
1313
5
1324
6
1329
7
1346
8
1347
9
1378
10
1394
11
1441
12
1469
Problem 3 You have realized that the sales for Select-A-Size Paper Towel packs have been increasing over the past year. You have learned that the double exponential smoothing method can account for such a trend in the data. Use double (trend-adjusted) exponential smoothing method to forecast sales...
excel spreadsheet information:
Month
Sales (in millions of boxes)
1
1306
2
1305
3
1311
4
1313
5
1324
6
1329
7
1346
8
1347
9
1378
10
1394
11
1441
12
1469
Problem 3 You have realized that the sales for Select-A-Size Paper Towel packs have been increasing over the past year. You have learned that the double exponential smoothing method can account for such a trend in the data. Use double (trend-adjusted) exponential smoothing method to forecast sales...
 2. (20 points) The following table shows the monthly sales in a local grocery store Month and 120 115 125 119 127 114 114 120 124 116 137 10 a. Suppose that Three-weeks moving average are used to forecast sales. Determine the one-step-ahead forecasts for weeks 4 through 10. b. Suppose that exponential smoothing is used with a smoothing constant α-02. Find the exponential smoothing forecasts weeks 4 through 10. (To get the method started, use 120.00 as the forecast...
 Consider the following actual and forecast demand levels for Big
Mac hamburgers at a local McDonald's restaurant:
Day Monday Tuesday Wednesday Thursday Friday Actual Demand 88.00 75.00 70.00 52.00 Forecast Demand 88.00 88.00 84.10 79.87 The forecast for Monday was derived by observing Monday's demand level and setting Monday's forecast level equal to this demand level. Subsequent forecasts were derived by using exponential smoothing with a smoothing constant of 0.30. Using this exponential smoothing method, the forecast for Big Mac...
Consider the following actual and forecast demand levels for Big
Mac hamburgers at a local McDonald's restaurant:
Day Monday Tuesday Wednesday Thursday Friday Actual Demand 88.00 75.00 70.00 52.00 Forecast Demand 88.00 88.00 84.10 79.87 The forecast for Monday was derived by observing Monday's demand level and setting Monday's forecast level equal to this demand level. Subsequent forecasts were derived by using exponential smoothing with a smoothing constant of 0.30. Using this exponential smoothing method, the forecast for Big Mac...
 Note: Data for these problems are in the Module 2 Individual Assignments Data file - there is a tab for each problem, All answers should be entered using two decimal places unless otherwise specified. If both decimal places are zeros-then just enter the integer value. Percentages should be entered without"%" sign- 3.45% should be entered as 3.45. M2 IND1. Mariah Henderson is a WCU student who has just finished her junior year. The data in Worksheet IND1 summarizes her grade...
 The answer is not the ones marked.
Kristen Pacheco owns a small restaurant that's open seven days a week. Until recently, she forecasted the daily number of customers she would have using her intuition. However, she wanted to open another restaurant and recognized the need to adopt a more formal method of forecasting that could be used in both locations. Kristen decided to compare a three week moving average forecast with exponential smoothing forecasts using a = .7 and a...
The answer is not the ones marked.
Kristen Pacheco owns a small restaurant that's open seven days a week. Until recently, she forecasted the daily number of customers she would have using her intuition. However, she wanted to open another restaurant and recognized the need to adopt a more formal method of forecasting that could be used in both locations. Kristen decided to compare a three week moving average forecast with exponential smoothing forecasts using a = .7 and a...
 excel spreadsheet information:
Month
Sales (in millions of boxes)
1
1306
2
1305
3
1311
4
1313
5
1324
6
1329
7
1346
8
1347
9
1378
10
1394
11
1441
12
1469
Problem 3 You have realized that the sales for Select-A-Size Paper Towel packs have been increasing over the past year. You have learned that the double exponential smoothing method can account for such a trend in the data. Use double (trend-adjusted) exponential smoothing method to forecast sales...
excel spreadsheet information:
Month
Sales (in millions of boxes)
1
1306
2
1305
3
1311
4
1313
5
1324
6
1329
7
1346
8
1347
9
1378
10
1394
11
1441
12
1469
Problem 3 You have realized that the sales for Select-A-Size Paper Towel packs have been increasing over the past year. You have learned that the double exponential smoothing method can account for such a trend in the data. Use double (trend-adjusted) exponential smoothing method to forecast sales...
Most questions answered within 3 hours.
-
Xanth Co. has 8.9% annual coupon bonds with face value of $1,000
and 7 years remaining...
asked 1 minute ago -
The Bellevue University bookstore purchases sweatshirts with the
school name and logo from a vendor. The...
asked 4 minutes ago -
Suppose X∼Exp(λ) for some λ >0. Compute E(X) and Var(X).
asked 4 minutes ago -
If you invest the $10,000 you receive at graduation in a mutual
fund which averages a...
asked 6 minutes ago -
Consider 15 mL of an aqueous solution containing 2.0 g of an
organic solute.If the distribution...
asked 6 minutes ago -
Define the following Marketing Psychology Principles of Human
Behavior: Priming, Reciprocity, Social Proof, Decoy Effect,
Scarcity,...
asked 22 minutes ago -
What does the graph of Range vs angle look like? Also what is
the slope of...
asked 25 minutes ago -
a
sample size of _ is needed So there a 99% confidence interval will
have a...
asked 30 minutes ago -
Strategy is an important part of project management and business
decisions. Define strategy and describe in...
asked 34 minutes ago -
Task 5.2 Numerical Analysis Using Nested Loops (13 pts)
Consider the following program:
void setup()
{...
asked 48 minutes ago -
If a lossless transformer has 1000 turns for a primary winding
and 100 turns for the...
asked 56 minutes ago -
Write the net ionic equation for the precipitation reaction that
occurs when aqueous solutions of potassium...
asked 1 hour ago