
The burden of the tax falls more heavily on the elastic side of the market. (less/more)
Homework Answers
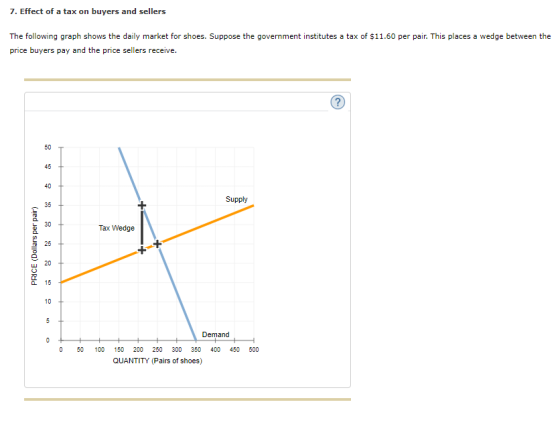
|
Q |
Price buyer pays($) |
price seller receives($) |
|
|
Bfore tax |
250 |
25 |
25 |
|
After tax |
210 |
35 |
23.40 (i.e. 35 - 11.60) |
|
Tax burden($) |
Elasticity |
|
|
Buyers |
10 (i.e. 35 - 25) |
0.52 |
|
Sellers |
1.60 (i.e. 25 - 23.40) |
2.63 |
Price elasticity of demand = (210 - 250) / (35 - 25) * (35 + 25) / (250 + 210)
= (-40 / 10) * (60 / 460)
= -2400 / 4600
= -0.52 (the absolute value is 0.52)
Price elasticity of supply = (210 - 250) / (23.40 - 25) * (25 + 23.40) / (250 + 210)
= (-40 /-1.60) * (48.40 / 460)
= 1936 / 736
= 2.63
Answer to blank 1: Less
Add Answer to:
The burden of the tax falls more heavily on the
elastic side of the market. (less/more)
7....
7. Effect of a tax on buyers and sellers The following graph shows the daily market...
 7. Effect of a tax on buyers and sellers The following graph shows the daily market for shces. Suppose the govenment institutes a tax of $11.60 per pair. This places a wedge between the price buyers pay and the price sellers receive. Supply Tax Wedge Demand 50100150200觊300 30 400 450 QUANTITY (Pairs of shoes) FI in the oowing tabie with the quantity sold, the price buyers pay, and the price sellers receive before and after the tax. Quantity (Pairs of...
The following graph shows the daily market for wine. Suppose the government institutes a tax of...
 The following graph shows the daily market for shoes. Suppose the government institutes a tax of $11.60 per pair. This places a wedge between the price buyers pay and the price sellers receive. Fill in the following table with the quantity sold, the price buyers pay, and the price sellers receive before and after the tax. Using the data you entered in the previous table, calculate the tax burden that falls on buyers and on sellers, respectively, and calculate the price elasticity...
The following graph shows the daily market for shoes. Suppose the government institutes a tax of $11.60 per pair....
The following graph shows the daily market for shoes. Suppose the government institutes a tax of $11.60 per pair. This places a wedge between the price buyers pay and the price sellers receive. Fill in the following table with the quantity sold, the price buyers pay, and the price sellers receive before and after the tax. Using the data you entered in the previous table, calculate the tax burden that falls on buyers and on sellers, respectively, and calculate the price elasticity...
6. Effect of a tax on buyers and sellers The following graph shows the daily market...
 6. Effect of a tax on buyers and sellers The following graph shows the daily market for shoes. Suppose the government institutes a tax of $11.60 per pair. This places a wedge between the price buyers pay and the price sellers receive. Supply Tax Wedge PRICE (Dollars per pair) Demand 0 100 200 800 900 1000 300 400 500 600 700 QUANTITY (Pairs of shoes) Fill in the following table with the quantity sold, the price buyers pay, and the...
7. Effect of a tax on buyers and sellers The following graph shows the daily market...
 7. Effect of a tax on buyers and sellers The following graph shows the daily market for shoes. Suppose the government institutes a tax of $11.60 per pair. This places a wedge between the price buyers pay and the price sellers receive 50 45 40 Supply 35 - a 30 25 W 20 a 15 10 Tax Wedge 1 Demand 0 50 100 150 200 250 300 350 400 450 500 QUANTITY (Pairs of shoes)
7. Effect of a tax on buyers and sellers The following graph shows the daily market...
 7. Effect of a tax on buyers and sellers The following graph shows the daily market for jeans. Suppose the government institutes a tax of $40.60 per pair. This places a wedge between the price buyers pay and the price sellers receive. Demand PRICE Dolars per pair Tax Wedge 0 00 200 000 000 Demand Supply PRICE (Dollars per pair Tax Wedge 0 50 100 150 200 250 300 350 QUANTITY (Pairs of jeans) 400 450 500 Fill in the...
The following graph shows the daily market for shoes. Suppose the government institutes a tax of $46.40 per pair.
 7. Effect of a tax on buyers and sellers The following graph shows the daily market for shoes. Suppose the government institutes a tax of $46.40 per pair. This places a wedge between the price buyers pay and the price sellers receive. Fill in the following table with the quantity sold, the price buyers pay, and the price sellers receive before and after the tax. Using the data you entered in the previous table, calculate the tax burden that falls on buyers and...
Better electronic answer format, thank you! 7. Effect of a tax on buyers and sellers The...
 Better electronic answer format,
thank you!
7. Effect of a tax on buyers and sellers The following graph shows the daily market for wine. Suppose the government institutes a tax of $46.40 per bottle. This places a wedge between the price buyers pay and the price sellers receive. Supply Tax Wedge PRICE (Dollars per bottle) Demand 0 + 0 + 50 100 400 450 500 150 200 250 300 350 QUANTITY (Bottles of wine) Fill in the following table with...
Better electronic answer format,
thank you!
7. Effect of a tax on buyers and sellers The following graph shows the daily market for wine. Suppose the government institutes a tax of $46.40 per bottle. This places a wedge between the price buyers pay and the price sellers receive. Supply Tax Wedge PRICE (Dollars per bottle) Demand 0 + 0 + 50 100 400 450 500 150 200 250 300 350 QUANTITY (Bottles of wine) Fill in the following table with...
Fill in the following table with the quantity sold, the price buyers pay, and the price...
 Fill in the following table with the quantity sold, the price
buyers pay, and the price sellers receive before and after the
tax.
Quantity
Price Buyers
Pay
Price Sellers
Receive
(Pairs of
jeans)
(Dollars per
pair)
(Dollars per
pair)
Before Tax
After Tax
Using the data you entered in the previous table, calculate the
tax burden that falls on buyers and on sellers, respectively, and
calculate the price elasticity of demand and supply over the
relevant ranges using the midpoint...
Fill in the following table with the quantity sold, the price
buyers pay, and the price sellers receive before and after the
tax.
Quantity
Price Buyers
Pay
Price Sellers
Receive
(Pairs of
jeans)
(Dollars per
pair)
(Dollars per
pair)
Before Tax
After Tax
Using the data you entered in the previous table, calculate the
tax burden that falls on buyers and on sellers, respectively, and
calculate the price elasticity of demand and supply over the
relevant ranges using the midpoint...
14. Effect of a tax on buyers and sellers The following graph shows the daily market...
 14. Effect of a tax on buyers and sellers The following graph shows the daily market for jeans when the tax on sellers is set at $0 per pair Suppose the government institutes a tax of $5.80 per pair, to be paid by the seller. (Hint: To see the impact of the tax, enter the value of the tax in the Tax on Sellers field and move the green line to the after-tax equilibrium by adjusting the value in the...
 7. Effect of a tax on buyers and sellers The following graph shows the daily market for shces. Suppose the govenment institutes a tax of $11.60 per pair. This places a wedge between the price buyers pay and the price sellers receive. Supply Tax Wedge Demand 50100150200觊300 30 400 450 QUANTITY (Pairs of shoes) FI in the oowing tabie with the quantity sold, the price buyers pay, and the price sellers receive before and after the tax. Quantity (Pairs of...
 6. Effect of a tax on buyers and sellers The following graph shows the daily market for shoes. Suppose the government institutes a tax of $11.60 per pair. This places a wedge between the price buyers pay and the price sellers receive. Supply Tax Wedge PRICE (Dollars per pair) Demand 0 100 200 800 900 1000 300 400 500 600 700 QUANTITY (Pairs of shoes) Fill in the following table with the quantity sold, the price buyers pay, and the...
 7. Effect of a tax on buyers and sellers The following graph shows the daily market for shoes. Suppose the government institutes a tax of $11.60 per pair. This places a wedge between the price buyers pay and the price sellers receive 50 45 40 Supply 35 - a 30 25 W 20 a 15 10 Tax Wedge 1 Demand 0 50 100 150 200 250 300 350 400 450 500 QUANTITY (Pairs of shoes)
 7. Effect of a tax on buyers and sellers The following graph shows the daily market for jeans. Suppose the government institutes a tax of $40.60 per pair. This places a wedge between the price buyers pay and the price sellers receive. Demand PRICE Dolars per pair Tax Wedge 0 00 200 000 000 Demand Supply PRICE (Dollars per pair Tax Wedge 0 50 100 150 200 250 300 350 QUANTITY (Pairs of jeans) 400 450 500 Fill in the...
 Better electronic answer format,
thank you!
7. Effect of a tax on buyers and sellers The following graph shows the daily market for wine. Suppose the government institutes a tax of $46.40 per bottle. This places a wedge between the price buyers pay and the price sellers receive. Supply Tax Wedge PRICE (Dollars per bottle) Demand 0 + 0 + 50 100 400 450 500 150 200 250 300 350 QUANTITY (Bottles of wine) Fill in the following table with...
Better electronic answer format,
thank you!
7. Effect of a tax on buyers and sellers The following graph shows the daily market for wine. Suppose the government institutes a tax of $46.40 per bottle. This places a wedge between the price buyers pay and the price sellers receive. Supply Tax Wedge PRICE (Dollars per bottle) Demand 0 + 0 + 50 100 400 450 500 150 200 250 300 350 QUANTITY (Bottles of wine) Fill in the following table with...
 Fill in the following table with the quantity sold, the price
buyers pay, and the price sellers receive before and after the
tax.
Quantity
Price Buyers
Pay
Price Sellers
Receive
(Pairs of
jeans)
(Dollars per
pair)
(Dollars per
pair)
Before Tax
After Tax
Using the data you entered in the previous table, calculate the
tax burden that falls on buyers and on sellers, respectively, and
calculate the price elasticity of demand and supply over the
relevant ranges using the midpoint...
Fill in the following table with the quantity sold, the price
buyers pay, and the price sellers receive before and after the
tax.
Quantity
Price Buyers
Pay
Price Sellers
Receive
(Pairs of
jeans)
(Dollars per
pair)
(Dollars per
pair)
Before Tax
After Tax
Using the data you entered in the previous table, calculate the
tax burden that falls on buyers and on sellers, respectively, and
calculate the price elasticity of demand and supply over the
relevant ranges using the midpoint...
 14. Effect of a tax on buyers and sellers The following graph shows the daily market for jeans when the tax on sellers is set at $0 per pair Suppose the government institutes a tax of $5.80 per pair, to be paid by the seller. (Hint: To see the impact of the tax, enter the value of the tax in the Tax on Sellers field and move the green line to the after-tax equilibrium by adjusting the value in the...
Most questions answered within 3 hours.
-
An entomologist discovers a dung beetle rolling a ball of dung
along the ground, and decides...
asked 56 minutes ago -
Humans have used horses for transportation for millions of
years. Therefore, they will use horses for...
asked 2 hours ago -
The following are the Jensen Corporation's unit costs of making
and selling an item at a...
asked 3 hours ago -
Does direct Medicare reimbursement of Advanced practice nurses
increase access to their services?
asked 4 hours ago -
List and explain why a company would choose to use a
published
compensation survey vs. creating...
asked 4 hours ago -
A discrete random variable X can take values from 1 to 10. Find
the variance of...
asked 4 hours ago -
The primary financial goal of a corporation is to maximize:
shareholders wealth.
earnings per share.
stock...
asked 4 hours ago -
determine whether the vectors u=(1,2,3,), v=(-2,1,0) and
w=(1,0,1) are linearly dependent or independent.
asked 4 hours ago -
python
Define a function called print_values which takes a dictionary
object as a parameter. The function...
asked 5 hours ago -
In Chapter 1 you created a program named Triangle in
which you displayed a seven-line triangle...
asked 5 hours ago -
Research question: What are the differences between separately
stated and non separately stated transactions in an...
asked 6 hours ago -
By using Arduino write a code that connects two LEDs to two
push-buttons. Each button controls...
asked 7 hours ago