given:


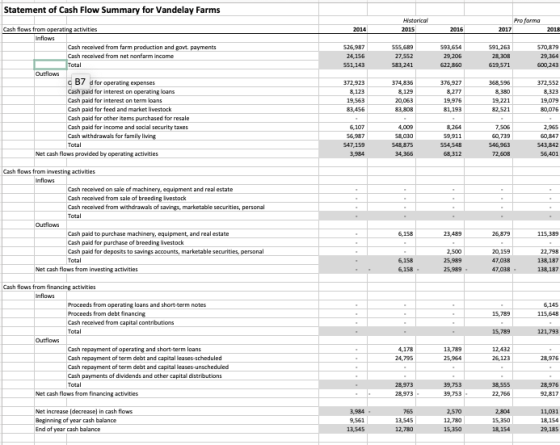
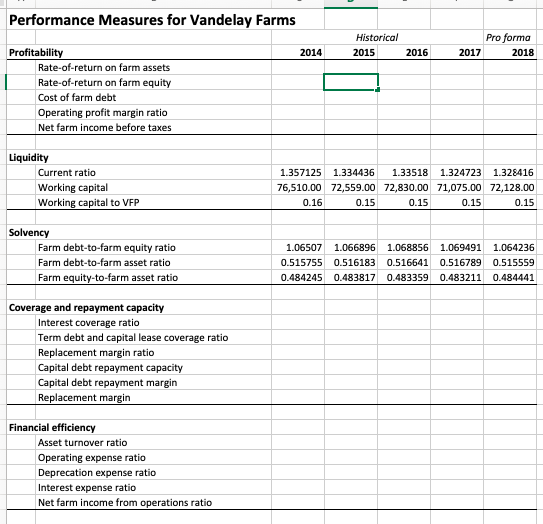
- Calculate all of the missing performance measures in the sheet “Performance Measures for Vandelay Farms" seen below. “CF” is the statement of cash flow summary for Vandelay Farms. Based on the performance ratios, is Vandelay Farms in any kind of financial trouble? Why or why not?
Homework Answers
Answer is
| Particulars | Historical | Proforma | ||||
| Formulae | 2014 | 2015 | 2016 | 2017 | 2018 | |
| Profitability | ||||||
| Rate of return on farm assets | Net farm income before taxes/Farm assets | 3.06% | 3.77% | 3.57% | 4.00% | 3.87% |
| Rate of return on farm equity | Net farm income before taxes/Farm equity | 6.32% | 7.80% | 7.38% | 8.28% | 7.98% |
| Cost of farm debt | interest expense/(non-real estate debt + real estate debt) | 10.41% | 10.79% | 11.30% | 10.73% | 10.81% |
| Operating profit margin ratio | EBIT/Sales | 14.07% | 15.87% | 15.66% | 16.18% | 15.87% |
| Net farm income before taxes | Net farm income before taxes | 33079 | 40875 | 38730 | 43389 | 42069 |
| Financial efficency | ||||||
| Asset turnover ratio | Turnover / assets | 42.19% | 42.36% | 42.61% | 42.68% | 42.78% |
| Operating expense ratio | Operating expense/Turnover | 80.08% | 79.11% | 78.95% | 78.24% | 78.17% |
| Depreciation expense ratio | Depreciation/Turnover | 5.84% | 5.03% | 5.39% | 5.58% | 5.95% |
| Interest expense ratio | Interest expense/Turnover | 7.21% | 7.43% | 7.72% | 7.29% | 7.30% |
| Net farm income from operations ratio | Net farm income from operations/turnover | 14.07% | 15.87% | 15.66% | 16.18% | 15.87% |
Add Answer to:
given:
Calculate all of the missing performance measures in the sheet
“Performance Measures for Vandelay Farms"...
Given the above Finacail Statemtns, Calculate all of the missing performance measures in sheet “PM” (below)...
 Given the above Finacail Statemtns, Calculate all of the missing
performance measures in sheet “PM” (below) for Vandelay Farms.“CF”
is the statement of cash flow summary for Vandelay Farms. Based on
the performance ratios, is Vandelay Farms in any kind of financial
trouble? Why or why not?
Balance Sheet Summary for Vandelay Farms Historica Pro 2017 Current assets Cash, savings, and marketable securities Crops, feed, and supplies Market livestock Accounts receivable Other current assets All personal assets Total current assets...
Given the above Finacail Statemtns, Calculate all of the missing
performance measures in sheet “PM” (below) for Vandelay Farms.“CF”
is the statement of cash flow summary for Vandelay Farms. Based on
the performance ratios, is Vandelay Farms in any kind of financial
trouble? Why or why not?
Balance Sheet Summary for Vandelay Farms Historica Pro 2017 Current assets Cash, savings, and marketable securities Crops, feed, and supplies Market livestock Accounts receivable Other current assets All personal assets Total current assets...
$ 145,600 Use the following information for Longliew Farms to answer problem 5. Crops & feed...
 $ 145,600 Use the following information for Longliew Farms to answer problem 5. Crops & feed revenue Livestock and livestock product revenue Total nonfarm income Total farm operating expenses Depreciation expense Income tax expense Interest expense Withdrawals for family living Principal payments on unpaid operating debts Principal payments on current portions of debt & leases 215,300 12,000 252,629 50,526 10,827 64,962 28,000 29,890 a) Calculate capital replacement and term debt repayment capacity for LongView Farms. b) Calculate capital replacement and...
Calculate the following measures of financial performance for Netflix in 2019: a. Operating profit margin b....
Calculate the following measures of financial performance for Netflix in 2019: a. Operating profit margin b. Total return on assets c. Current ratio d. Working capital e. Long-term debt to capital ratio f. Price to earnings ratio
Complete the SOE and worksheet using the information below. Change Excess of Market over Book Values...
 Complete the SOE and worksheet using the information below. Change Excess of Market over Book Values (Market - Book) Item: 12/31/2018 Machinery and Equipment -$10,000 Land $0 Buildings $0 Marketable Securities $13,000 Other Investments (local brewery) $20,000 12/31/2019 $5,000 $5,000 $10,000 $5,000 $22,000 Selected Account Balances: Current Deferred Taxes Non-current Deferred Taxes Non-real estate long-term loan balance Total Equity $2,492 $3,000 $165,000 $232,009 $1,359 $12,601 $220,000 $323,041 $91,032 Other Information: 2019 Net Income for Illini Tap was: $151,633 No capital...
With this information, would it be possible to calculate the cash coverage ratio for this company?...
 With this information, would it be possible to calculate the
cash coverage ratio for this company? Or am I missing information
still? If possible, could you please calculate it and explain how
you got it.
Financial & Operating Summary Year ended December 31 in millions of US dollars, unless otherwise noted 2019 2018 Change (96) Financial Performance $ $ 19,636 Sales Gross Margin EBITDA 20,023 5,441 3,661 5.392 -83 2.006 3,934 Adjusted EBITDA 4,025 -2 Retail EBITDA 1,231 1.206 1593...
With this information, would it be possible to calculate the
cash coverage ratio for this company? Or am I missing information
still? If possible, could you please calculate it and explain how
you got it.
Financial & Operating Summary Year ended December 31 in millions of US dollars, unless otherwise noted 2019 2018 Change (96) Financial Performance $ $ 19,636 Sales Gross Margin EBITDA 20,023 5,441 3,661 5.392 -83 2.006 3,934 Adjusted EBITDA 4,025 -2 Retail EBITDA 1,231 1.206 1593...
Review Problems 1 Given the following financial information, calculate the missing values $1,000 95,000 Cash Crop...
 Review Problems 1 Given the following financial information, calculate the missing values $1,000 95,000 Cash Crop revenue Grain inventory Total operating expenses Prepaid expenses Notes payable Accrued interest Interest expense Supplies Owner equity 200 10,000 Machinery and equipment Farm real estate Total current assets $75,000 Total current liabilities 150,000 Accounts payable 17,500 Cash investment in growing 14,000 crops 2.000 Net farm income from 800 operations 27,000 Current portion of noncurrent 1.500 debt Deferred portion of noncurrent debt 10,000 500 138,500...
1) calculate Free Cash Flows to Equity for 2018. Include cash in all measures of working...
 1) calculate Free Cash Flows to Equity for 2018. Include cash in
all measures of working capital for purposes of these
calculations:
Jimmy's Corp. Annual Income Statements For Years Ending December 31 Sales Cost of sales Gross profit 2017 $156,121,419 55.330.466 100,790,953 2018 $173,219,147 60.213.877 113,005,270 Net operating expenses Operating income 84.109.861 16,681,092 94.003.364 19,001,906 Other income (expense) Interest expense (1,629,942) (1,680,884) (981,955) (2,109,889) Pretax net income 13,370,266 15,910,062 Taxes (sub S) Net income (loss) $13,370,266 $15,910,062 2018 Jimmy's Corp....
1) calculate Free Cash Flows to Equity for 2018. Include cash in
all measures of working capital for purposes of these
calculations:
Jimmy's Corp. Annual Income Statements For Years Ending December 31 Sales Cost of sales Gross profit 2017 $156,121,419 55.330.466 100,790,953 2018 $173,219,147 60.213.877 113,005,270 Net operating expenses Operating income 84.109.861 16,681,092 94.003.364 19,001,906 Other income (expense) Interest expense (1,629,942) (1,680,884) (981,955) (2,109,889) Pretax net income 13,370,266 15,910,062 Taxes (sub S) Net income (loss) $13,370,266 $15,910,062 2018 Jimmy's Corp....
Ratios Calculate all* of the ratios listed in exhibit 14-26, "Summary of Analytical Measures," for Carnival...
 Ratios
Calculate all* of the ratios listed in exhibit 14-26, "Summary
of Analytical Measures," for Carnival Corp in 2018 (you do not need
to do ratios for 2017).
* Because Carnival inventory sales are a small fraction of their
revenues, do not calculate Inventory Turnover, Days Sales in
Inventory, or Gross Profit. You also do not need to calculate EPS
or Return on Common Stockholders' Equity
In any place where the formula calls for an average, use the
2017 number...
Ratios
Calculate all* of the ratios listed in exhibit 14-26, "Summary
of Analytical Measures," for Carnival Corp in 2018 (you do not need
to do ratios for 2017).
* Because Carnival inventory sales are a small fraction of their
revenues, do not calculate Inventory Turnover, Days Sales in
Inventory, or Gross Profit. You also do not need to calculate EPS
or Return on Common Stockholders' Equity
In any place where the formula calls for an average, use the
2017 number...
Marin Inc.’s CFO has just left the office of the company president after a meeting about the draft SFP at April 30, 2020, and income statement for the year then ended. (Both are reproduced below.) “Our liquidity position looks healthy,” the president had
Marin Inc.’s CFO has just left the office of the company president after a meeting about the draft SFP at April 30, 2020, and income statement for the year then ended. (Both are reproduced below.) “Our liquidity position looks healthy,” the president had remarked. “Look at the current and acid-test ratios, and the amount of working capital we have. And between the goodwill write off and depreciation, we have almost $23 million of non-cash expenses. I don’t understand why you’ve been...
 Given the above Finacail Statemtns, Calculate all of the missing
performance measures in sheet “PM” (below) for Vandelay Farms.“CF”
is the statement of cash flow summary for Vandelay Farms. Based on
the performance ratios, is Vandelay Farms in any kind of financial
trouble? Why or why not?
Balance Sheet Summary for Vandelay Farms Historica Pro 2017 Current assets Cash, savings, and marketable securities Crops, feed, and supplies Market livestock Accounts receivable Other current assets All personal assets Total current assets...
Given the above Finacail Statemtns, Calculate all of the missing
performance measures in sheet “PM” (below) for Vandelay Farms.“CF”
is the statement of cash flow summary for Vandelay Farms. Based on
the performance ratios, is Vandelay Farms in any kind of financial
trouble? Why or why not?
Balance Sheet Summary for Vandelay Farms Historica Pro 2017 Current assets Cash, savings, and marketable securities Crops, feed, and supplies Market livestock Accounts receivable Other current assets All personal assets Total current assets...
 $ 145,600 Use the following information for Longliew Farms to answer problem 5. Crops & feed revenue Livestock and livestock product revenue Total nonfarm income Total farm operating expenses Depreciation expense Income tax expense Interest expense Withdrawals for family living Principal payments on unpaid operating debts Principal payments on current portions of debt & leases 215,300 12,000 252,629 50,526 10,827 64,962 28,000 29,890 a) Calculate capital replacement and term debt repayment capacity for LongView Farms. b) Calculate capital replacement and...
 Complete the SOE and worksheet using the information below. Change Excess of Market over Book Values (Market - Book) Item: 12/31/2018 Machinery and Equipment -$10,000 Land $0 Buildings $0 Marketable Securities $13,000 Other Investments (local brewery) $20,000 12/31/2019 $5,000 $5,000 $10,000 $5,000 $22,000 Selected Account Balances: Current Deferred Taxes Non-current Deferred Taxes Non-real estate long-term loan balance Total Equity $2,492 $3,000 $165,000 $232,009 $1,359 $12,601 $220,000 $323,041 $91,032 Other Information: 2019 Net Income for Illini Tap was: $151,633 No capital...
 With this information, would it be possible to calculate the
cash coverage ratio for this company? Or am I missing information
still? If possible, could you please calculate it and explain how
you got it.
Financial & Operating Summary Year ended December 31 in millions of US dollars, unless otherwise noted 2019 2018 Change (96) Financial Performance $ $ 19,636 Sales Gross Margin EBITDA 20,023 5,441 3,661 5.392 -83 2.006 3,934 Adjusted EBITDA 4,025 -2 Retail EBITDA 1,231 1.206 1593...
With this information, would it be possible to calculate the
cash coverage ratio for this company? Or am I missing information
still? If possible, could you please calculate it and explain how
you got it.
Financial & Operating Summary Year ended December 31 in millions of US dollars, unless otherwise noted 2019 2018 Change (96) Financial Performance $ $ 19,636 Sales Gross Margin EBITDA 20,023 5,441 3,661 5.392 -83 2.006 3,934 Adjusted EBITDA 4,025 -2 Retail EBITDA 1,231 1.206 1593...
 Review Problems 1 Given the following financial information, calculate the missing values $1,000 95,000 Cash Crop revenue Grain inventory Total operating expenses Prepaid expenses Notes payable Accrued interest Interest expense Supplies Owner equity 200 10,000 Machinery and equipment Farm real estate Total current assets $75,000 Total current liabilities 150,000 Accounts payable 17,500 Cash investment in growing 14,000 crops 2.000 Net farm income from 800 operations 27,000 Current portion of noncurrent 1.500 debt Deferred portion of noncurrent debt 10,000 500 138,500...
 1) calculate Free Cash Flows to Equity for 2018. Include cash in
all measures of working capital for purposes of these
calculations:
Jimmy's Corp. Annual Income Statements For Years Ending December 31 Sales Cost of sales Gross profit 2017 $156,121,419 55.330.466 100,790,953 2018 $173,219,147 60.213.877 113,005,270 Net operating expenses Operating income 84.109.861 16,681,092 94.003.364 19,001,906 Other income (expense) Interest expense (1,629,942) (1,680,884) (981,955) (2,109,889) Pretax net income 13,370,266 15,910,062 Taxes (sub S) Net income (loss) $13,370,266 $15,910,062 2018 Jimmy's Corp....
1) calculate Free Cash Flows to Equity for 2018. Include cash in
all measures of working capital for purposes of these
calculations:
Jimmy's Corp. Annual Income Statements For Years Ending December 31 Sales Cost of sales Gross profit 2017 $156,121,419 55.330.466 100,790,953 2018 $173,219,147 60.213.877 113,005,270 Net operating expenses Operating income 84.109.861 16,681,092 94.003.364 19,001,906 Other income (expense) Interest expense (1,629,942) (1,680,884) (981,955) (2,109,889) Pretax net income 13,370,266 15,910,062 Taxes (sub S) Net income (loss) $13,370,266 $15,910,062 2018 Jimmy's Corp....
 Ratios
Calculate all* of the ratios listed in exhibit 14-26, "Summary
of Analytical Measures," for Carnival Corp in 2018 (you do not need
to do ratios for 2017).
* Because Carnival inventory sales are a small fraction of their
revenues, do not calculate Inventory Turnover, Days Sales in
Inventory, or Gross Profit. You also do not need to calculate EPS
or Return on Common Stockholders' Equity
In any place where the formula calls for an average, use the
2017 number...
Ratios
Calculate all* of the ratios listed in exhibit 14-26, "Summary
of Analytical Measures," for Carnival Corp in 2018 (you do not need
to do ratios for 2017).
* Because Carnival inventory sales are a small fraction of their
revenues, do not calculate Inventory Turnover, Days Sales in
Inventory, or Gross Profit. You also do not need to calculate EPS
or Return on Common Stockholders' Equity
In any place where the formula calls for an average, use the
2017 number...
Most questions answered within 3 hours.
-
X Company is trying to decide whether to continue using old
equipment to make Product A...
asked 24 minutes ago -
Minitab Problem: Take the Lake Hume June rainfall data and find
use the processes outlined in...
asked 23 minutes ago -
IN PYTHON ONLY !! Program 2: Re-work
program #5 (WeeklyHours) from the previous assignment such that...
asked 1 hour ago -
The average length of time between arrivals at a turnpike
toll-booth is 26 seconds. What is...
asked 2 hours ago -
(a) A piston at 6.1 atm contains a gas that occupies a volume of
3.5 L....
asked 3 hours ago -
Please answer true or false. Words
cannot be changed or added in to make it true...
asked 3 hours ago -
An empty test tube weighs 15.923 grams. Then,
MgCl2•6H2O is added into the test tube. After...
asked 3 hours ago -
Assume memory access is 10 units of time and disk access is
10000 units of time....
asked 4 hours ago -
1. Are all good samples random?
2. Magazines often report surveys giving statistics such as “63%...
asked 4 hours ago -
Under all the various types of market structures, firms
must eventually earn some economic profits for...
asked 4 hours ago -
Consider the following fitness regime for a single locus trait
with two co-dominant alleles: w11 =...
asked 4 hours ago -
A large cable company reports the following.
80% of its customers subscribe to its cable TV...
asked 4 hours ago