Ratios
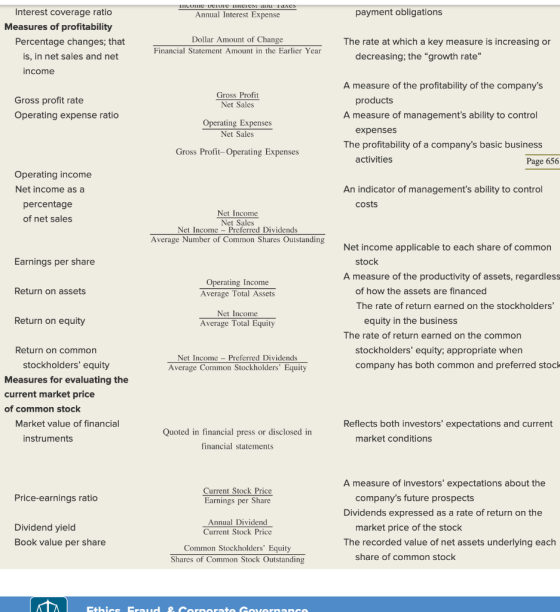
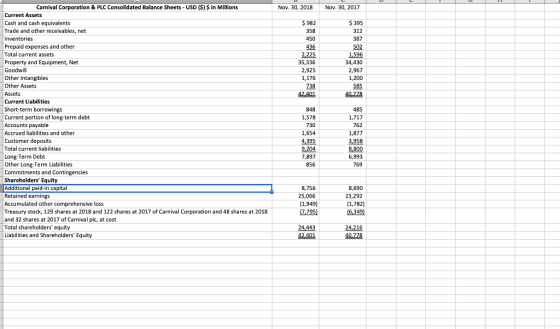
Calculate all* of the ratios listed in exhibit 14-26, "Summary of Analytical Measures," for Carnival Corp in 2018 (you do not need to do ratios for 2017).
* Because Carnival inventory sales are a small fraction of their revenues, do not calculate Inventory Turnover, Days Sales in Inventory, or Gross Profit. You also do not need to calculate EPS or Return on Common Stockholders' Equity
In any place where the formula calls for an average, use the 2017 number plus the 2018 number divided by 2.

Homework Answers
| current ratio | current assets / current liabilities |
| 2018 ($ million) | |
| current assets | 2225 |
| current liabilities | 9204 |
| current ratio | 0.24 |
| quick ratio | quick assets / current liabilities |
| 2018 ($ million) | |
| cash | 982 |
| trade and receivable | 358 |
| total quick assets | 1340 |
| current liabilities | 9204 |
| quick ratio | 0.15 |
| working capital | current assets - current liabilities |
| 2018 ($ million) | |
| current assets | 2225 |
| current liabilities | 9204 |
| working capital | -6979 |
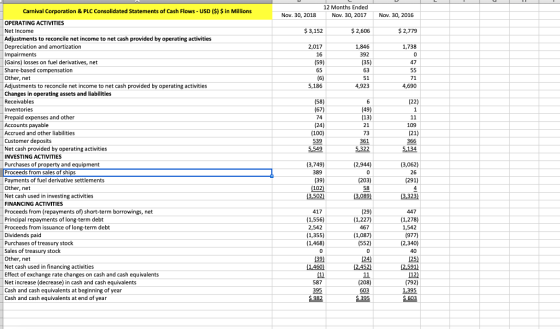
| net cash provided by operating activities | from cash flow statement |
| 2018 ($ million) | |
| net cash provided by operating activities | 5549 |
| cash flow from operations to current liabilities | cash flow from operating activites / current liabilities |
| 2018 ($ million) | |
| cash flow from operating activites | 5549 |
| current liabilities | 9204 |
| cash flow from operations to current liabilities | 0.602890048 |
| accounts receivable turnover | net sales / average accounts receivable |
| 2018 ($ million) | |
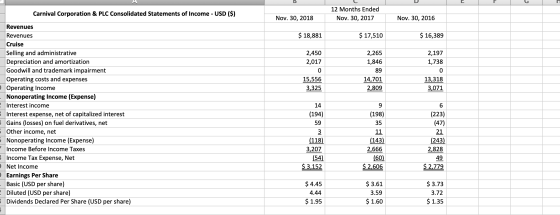
| net sales | 18881 |
| opening accounts receivable | 358 |
| closing accounts receivable | 312 |
| average accounts receivable | 335 |
| accounts receivable turnover | 56.36 |
| days to collect average account receivable | 365 / accounts receivable turnover |
| 2018 ($ million) | |
| accounts receivable turnover | 56.36 |
| days to collect average account receivable | 6.48 |
| operating cycle free cash flow | net cash from operating activities - cash used for investing activites and dividend |
| 2018 ($ million) | |
| net cash provided by operating activities | 5549 |
| less cash used for investing activites | 3502 |
| less dividend | 1355 |
| operating cycle free cash flow | 692 |
| debt ratio | total liabilities / total assets |
| 2018 ($ million) | |
| current liabilities | 9204 |
| long-term debt | 7897 |
| other long term liabilities | 856 |
| total liabilities | 17957 |
| total assets | 42401 |
| debt ratio | 0.42 |
| trend in net cash provided operating activities | from cash flow statement (difference 2018 - 2017) |
| 2018 ($ million) | |
| increasing trend | 227 |
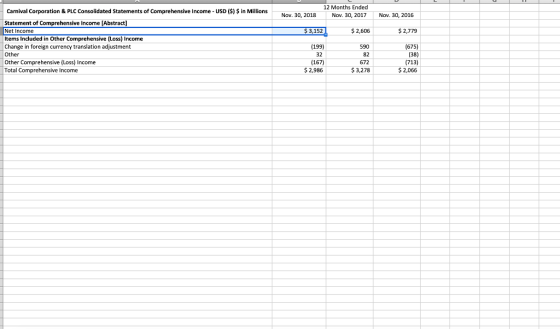
| interest coverage ratio | earnings before interest and tax / interest expense |
| 2018 ($ million) | |
| earnings before interest and tax | 3325 |
| interest expense | 194 |
| interest coverage ratio | 17.14 |
| operating expenses ratio | operating expenses / net sales |
| 2018 ($ million) | |
| operating expenses | 15556 |
| net sales | 18881 |
| operating expenses ratio | 0.82 |
| return on assets | operating income / average total assets |
| 2018 ($ million) | |
| operating income | 3325 |
| opening total assets | 40778 |
| closing total assets | 42401 |
| average total assets | 41589.5 |
| return on assets | 0.08 |
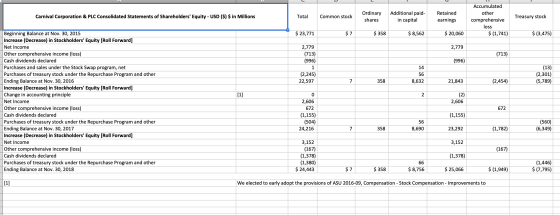
| return on equity | net income / average total equity |
| 2018 ($ million) | |
| net income | 3152 |
| opening equity | 24216 |
| closing equity | 24443 |
| average total equity | 24329.5 |
| return on equity | 0.13 |
Add Answer to:
Ratios
Calculate all* of the ratios listed in exhibit 14-26, "Summary
of Analytical Measures," for Carnival...
EXHIBIT 14-26 Summary of Analytical Measures Ratios or Other Measurements Method of Computation Significance Measures of...
 EXHIBIT 14-26 Summary of Analytical Measures Ratios or Other Measurements Method of Computation Significance Measures of short-term liquidi Current ratio ab Current Liabilities Quick ratio A measure of short-term debt Current Liabilities A measure of short-term debt tes the cash generated by operations Indicates ability to cover currently maturing Indicates how quickly receivables are collected Indicates in d ons Average Inventory to sell the a 365 Days Days to Sell I Free cash flow Net Cash from Debt ratic ion...
Balance Sheet Ratios for 2004 and 2005 Calculate the Current Ratio Calculate the Book Debt to...
 Balance Sheet Ratios for 2004 and 2005
Calculate the Current Ratio
Calculate the Book Debt to Equity Ratio
Calculate the Market Debt to Equity Ratio (Use Book
Value of Debt and Market Capitalization using basic shares
outstanding and assuming stock prices of $56.89/share in 2005 and
$58.93/share in 2004.)
Calculate the Enterprise Value of Clorox using the
Market Capitalization from above.
Yours ended June 30 (dollars in milions, except per share amounts) 2005 2004 2003 $ Net sales Cost of...
Balance Sheet Ratios for 2004 and 2005
Calculate the Current Ratio
Calculate the Book Debt to Equity Ratio
Calculate the Market Debt to Equity Ratio (Use Book
Value of Debt and Market Capitalization using basic shares
outstanding and assuming stock prices of $56.89/share in 2005 and
$58.93/share in 2004.)
Calculate the Enterprise Value of Clorox using the
Market Capitalization from above.
Yours ended June 30 (dollars in milions, except per share amounts) 2005 2004 2003 $ Net sales Cost of...
Use the information from the Income Statements and Balance Sheets to calculate the ratios in the...
 Use the information from the Income Statements and
Balance Sheets to calculate the ratios in the image below for years
provided (Numbers 1-6):
Please provide examples of each equation used so that I
may create an excel file and replicate process.
Jan. 27, 2019 12 Months Ended Jan. 28, Jan. 29, 2018 2017 Jan. 31, 2016 $ 11,716 4,545 7,171 $ 9,714 3,892 5,822 $ 6,910 2,847 4,063 $ 5,010 2,199 2,811 1,797 2,376 991 1,463 663 815 3 2,612...
Use the information from the Income Statements and
Balance Sheets to calculate the ratios in the image below for years
provided (Numbers 1-6):
Please provide examples of each equation used so that I
may create an excel file and replicate process.
Jan. 27, 2019 12 Months Ended Jan. 28, Jan. 29, 2018 2017 Jan. 31, 2016 $ 11,716 4,545 7,171 $ 9,714 3,892 5,822 $ 6,910 2,847 4,063 $ 5,010 2,199 2,811 1,797 2,376 991 1,463 663 815 3 2,612...
For each year listed in Exhibit 1 (2009 – 2014), calculate the following ratios: Bakery-Café Cost...
 For each year listed in Exhibit 1
(2009 – 2014), calculate the following ratios:
Bakery-Café Cost of Sales (formula: Bakery-Café
Expenses/Bakery-Café Sales)
Operating Profit Margin (Operating Profit/Total Revenues)
G&A as a percent of Total Revenues
Net Income Margin (Net Income to shareholders/Total
Revenues)
Return on Equity (Net Income to Shareholders/Total
Stockholder’s Equity)
Return on Assets (Net Income to Shareholders/Total Assets)
Debt-to-Assets (Total Liabilities/Total Assets)
Debt-to-Equity (Total Liabilities/Total Stockholder’s
Equity)
Current Ratio (Current Assets/Current Liabilities)
Note: 2010 is missing from the...
For each year listed in Exhibit 1
(2009 – 2014), calculate the following ratios:
Bakery-Café Cost of Sales (formula: Bakery-Café
Expenses/Bakery-Café Sales)
Operating Profit Margin (Operating Profit/Total Revenues)
G&A as a percent of Total Revenues
Net Income Margin (Net Income to shareholders/Total
Revenues)
Return on Equity (Net Income to Shareholders/Total
Stockholder’s Equity)
Return on Assets (Net Income to Shareholders/Total Assets)
Debt-to-Assets (Total Liabilities/Total Assets)
Debt-to-Equity (Total Liabilities/Total Stockholder’s
Equity)
Current Ratio (Current Assets/Current Liabilities)
Note: 2010 is missing from the...
1. “FS” indicate which financial statement will include each account listed on the working trial balance...
 1. “FS” indicate which financial statement will include each
account listed on the working trial balance using these
abbreviations:
B for balance sheet
I for income statement
C for statement of comprehensive income
S for statement of shareholders’ equity
2. Make trail balance, income statement and balance sheet
Consolidated Condensed Balance Sheets - USD ($) $ in Millions F/S Mar. 30, 2019 DR $80.60 401.2 CR 25.7 Cash and cash equivalents Accounts receivable Allowance for Bad Debt Short term investments...
1. “FS” indicate which financial statement will include each
account listed on the working trial balance using these
abbreviations:
B for balance sheet
I for income statement
C for statement of comprehensive income
S for statement of shareholders’ equity
2. Make trail balance, income statement and balance sheet
Consolidated Condensed Balance Sheets - USD ($) $ in Millions F/S Mar. 30, 2019 DR $80.60 401.2 CR 25.7 Cash and cash equivalents Accounts receivable Allowance for Bad Debt Short term investments...
Based on the following balance sheet and income statement. Identify all financial ratios listed for each...
Based on the following balance sheet and income statement. Identify all financial ratios listed for each year. *Feel free to just do the first year! I need to check to make sure my answers are appropriate. Thanks! ANNUAL BALANCE SHEET ($ Thousands) 31-Dec-15 31-Dec-16 31-Dec-15 31-Dec-16 ASSETS Profitability Ratios (in %) Cash & Short-Term Investments $17.11 $25.05 Return on equity Net Receivables $1.62 $1.84 Return on assets Inventories $42.72 $39.68 Return on invested capital Prepaid Expenses $0.00 $0.00 Profit margin...
Please include steps. (calculate for both 2010 & 2011) I have attached all financial statements Annual...
 Please include steps. (calculate for both 2010 &
2011)
I have attached all financial statements
Annual Data 1 Millions of US $ except per share data 2011-09-30 2010-09-30 2009 Revenue Cost Of Goods Sold Gross Profit $108,249 $64,431 $43,818 $2,429 $7,599 $65,225 $39,541 $25,684 $1,782 $5,517 $74,459 $33,790 $415 $34,205 $8,283 $25,922 EEEEE EE EE E E E E E E E E E E Research And Development Expenses SG&A Expenses Other Operating Income Or Expenses Operating Expenses Operating Income...
Please include steps. (calculate for both 2010 &
2011)
I have attached all financial statements
Annual Data 1 Millions of US $ except per share data 2011-09-30 2010-09-30 2009 Revenue Cost Of Goods Sold Gross Profit $108,249 $64,431 $43,818 $2,429 $7,599 $65,225 $39,541 $25,684 $1,782 $5,517 $74,459 $33,790 $415 $34,205 $8,283 $25,922 EEEEE EE EE E E E E E E E E E E Research And Development Expenses SG&A Expenses Other Operating Income Or Expenses Operating Expenses Operating Income...
Calculate the following financial ratios for fiscal year 2018 only using the "Consolidated Statements of Earn"...
 Calculate the following financial ratios for fiscal year 2018
only using the "Consolidated Statements of Earn" and "Consolidated
Balance Sheets" worksheets in Starbucks 2017 and 2018 Annual
Financial Statements : Current Ratio, Cash Ratio, Inventory
Turnover, Days Sales in Inventory, Long Term Debt Ratio, Times
Interest Earned, Gross Profit Margin, Net Profit Margin, Return on
Equity, Return on Assets.
12 Months Ended Oct. 01, 2017 Sep. 30, 2018 Oct. 02, 2016 $ 22,386.8 9,034,3 6,493.3 500.3 1,011.4 1,450.7 153.5 18,643.5...
Calculate the following financial ratios for fiscal year 2018
only using the "Consolidated Statements of Earn" and "Consolidated
Balance Sheets" worksheets in Starbucks 2017 and 2018 Annual
Financial Statements : Current Ratio, Cash Ratio, Inventory
Turnover, Days Sales in Inventory, Long Term Debt Ratio, Times
Interest Earned, Gross Profit Margin, Net Profit Margin, Return on
Equity, Return on Assets.
12 Months Ended Oct. 01, 2017 Sep. 30, 2018 Oct. 02, 2016 $ 22,386.8 9,034,3 6,493.3 500.3 1,011.4 1,450.7 153.5 18,643.5...
Calculate the following financial ratios for fiscal year 2018 only using the "Consolidated Statements of Earn"...
 Calculate the following financial ratios for fiscal year 2018
only using the "Consolidated Statements of Earn" and "Consolidated
Balance Sheets" worksheets in Starbucks 2017 and 2018 Annual
Financial Statements: Current Ratio, Cash Ratio, Inventory
Turnover, Days Sales in Inventory, Long Term Debt Ratio, Times
Interest Earned, Gross Profit Margin, Net Profit Margin, Return on
Equity, Return on Assets.
12 Months Ended Oct. 01, 2017 Sep. 30, 2018 Oct. 02, 2016 $ 22,386.8 9,034,3 6,493.3 500.3 1,011.4 1,450.7 153.5 18,643.5 $...
Calculate the following financial ratios for fiscal year 2018
only using the "Consolidated Statements of Earn" and "Consolidated
Balance Sheets" worksheets in Starbucks 2017 and 2018 Annual
Financial Statements: Current Ratio, Cash Ratio, Inventory
Turnover, Days Sales in Inventory, Long Term Debt Ratio, Times
Interest Earned, Gross Profit Margin, Net Profit Margin, Return on
Equity, Return on Assets.
12 Months Ended Oct. 01, 2017 Sep. 30, 2018 Oct. 02, 2016 $ 22,386.8 9,034,3 6,493.3 500.3 1,011.4 1,450.7 153.5 18,643.5 $...
 EXHIBIT 14-26 Summary of Analytical Measures Ratios or Other Measurements Method of Computation Significance Measures of short-term liquidi Current ratio ab Current Liabilities Quick ratio A measure of short-term debt Current Liabilities A measure of short-term debt tes the cash generated by operations Indicates ability to cover currently maturing Indicates how quickly receivables are collected Indicates in d ons Average Inventory to sell the a 365 Days Days to Sell I Free cash flow Net Cash from Debt ratic ion...
 Balance Sheet Ratios for 2004 and 2005
Calculate the Current Ratio
Calculate the Book Debt to Equity Ratio
Calculate the Market Debt to Equity Ratio (Use Book
Value of Debt and Market Capitalization using basic shares
outstanding and assuming stock prices of $56.89/share in 2005 and
$58.93/share in 2004.)
Calculate the Enterprise Value of Clorox using the
Market Capitalization from above.
Yours ended June 30 (dollars in milions, except per share amounts) 2005 2004 2003 $ Net sales Cost of...
Balance Sheet Ratios for 2004 and 2005
Calculate the Current Ratio
Calculate the Book Debt to Equity Ratio
Calculate the Market Debt to Equity Ratio (Use Book
Value of Debt and Market Capitalization using basic shares
outstanding and assuming stock prices of $56.89/share in 2005 and
$58.93/share in 2004.)
Calculate the Enterprise Value of Clorox using the
Market Capitalization from above.
Yours ended June 30 (dollars in milions, except per share amounts) 2005 2004 2003 $ Net sales Cost of...
 Use the information from the Income Statements and
Balance Sheets to calculate the ratios in the image below for years
provided (Numbers 1-6):
Please provide examples of each equation used so that I
may create an excel file and replicate process.
Jan. 27, 2019 12 Months Ended Jan. 28, Jan. 29, 2018 2017 Jan. 31, 2016 $ 11,716 4,545 7,171 $ 9,714 3,892 5,822 $ 6,910 2,847 4,063 $ 5,010 2,199 2,811 1,797 2,376 991 1,463 663 815 3 2,612...
Use the information from the Income Statements and
Balance Sheets to calculate the ratios in the image below for years
provided (Numbers 1-6):
Please provide examples of each equation used so that I
may create an excel file and replicate process.
Jan. 27, 2019 12 Months Ended Jan. 28, Jan. 29, 2018 2017 Jan. 31, 2016 $ 11,716 4,545 7,171 $ 9,714 3,892 5,822 $ 6,910 2,847 4,063 $ 5,010 2,199 2,811 1,797 2,376 991 1,463 663 815 3 2,612...
 For each year listed in Exhibit 1
(2009 – 2014), calculate the following ratios:
Bakery-Café Cost of Sales (formula: Bakery-Café
Expenses/Bakery-Café Sales)
Operating Profit Margin (Operating Profit/Total Revenues)
G&A as a percent of Total Revenues
Net Income Margin (Net Income to shareholders/Total
Revenues)
Return on Equity (Net Income to Shareholders/Total
Stockholder’s Equity)
Return on Assets (Net Income to Shareholders/Total Assets)
Debt-to-Assets (Total Liabilities/Total Assets)
Debt-to-Equity (Total Liabilities/Total Stockholder’s
Equity)
Current Ratio (Current Assets/Current Liabilities)
Note: 2010 is missing from the...
For each year listed in Exhibit 1
(2009 – 2014), calculate the following ratios:
Bakery-Café Cost of Sales (formula: Bakery-Café
Expenses/Bakery-Café Sales)
Operating Profit Margin (Operating Profit/Total Revenues)
G&A as a percent of Total Revenues
Net Income Margin (Net Income to shareholders/Total
Revenues)
Return on Equity (Net Income to Shareholders/Total
Stockholder’s Equity)
Return on Assets (Net Income to Shareholders/Total Assets)
Debt-to-Assets (Total Liabilities/Total Assets)
Debt-to-Equity (Total Liabilities/Total Stockholder’s
Equity)
Current Ratio (Current Assets/Current Liabilities)
Note: 2010 is missing from the...
 1. “FS” indicate which financial statement will include each
account listed on the working trial balance using these
abbreviations:
B for balance sheet
I for income statement
C for statement of comprehensive income
S for statement of shareholders’ equity
2. Make trail balance, income statement and balance sheet
Consolidated Condensed Balance Sheets - USD ($) $ in Millions F/S Mar. 30, 2019 DR $80.60 401.2 CR 25.7 Cash and cash equivalents Accounts receivable Allowance for Bad Debt Short term investments...
1. “FS” indicate which financial statement will include each
account listed on the working trial balance using these
abbreviations:
B for balance sheet
I for income statement
C for statement of comprehensive income
S for statement of shareholders’ equity
2. Make trail balance, income statement and balance sheet
Consolidated Condensed Balance Sheets - USD ($) $ in Millions F/S Mar. 30, 2019 DR $80.60 401.2 CR 25.7 Cash and cash equivalents Accounts receivable Allowance for Bad Debt Short term investments...
 Please include steps. (calculate for both 2010 &
2011)
I have attached all financial statements
Annual Data 1 Millions of US $ except per share data 2011-09-30 2010-09-30 2009 Revenue Cost Of Goods Sold Gross Profit $108,249 $64,431 $43,818 $2,429 $7,599 $65,225 $39,541 $25,684 $1,782 $5,517 $74,459 $33,790 $415 $34,205 $8,283 $25,922 EEEEE EE EE E E E E E E E E E E Research And Development Expenses SG&A Expenses Other Operating Income Or Expenses Operating Expenses Operating Income...
Please include steps. (calculate for both 2010 &
2011)
I have attached all financial statements
Annual Data 1 Millions of US $ except per share data 2011-09-30 2010-09-30 2009 Revenue Cost Of Goods Sold Gross Profit $108,249 $64,431 $43,818 $2,429 $7,599 $65,225 $39,541 $25,684 $1,782 $5,517 $74,459 $33,790 $415 $34,205 $8,283 $25,922 EEEEE EE EE E E E E E E E E E E Research And Development Expenses SG&A Expenses Other Operating Income Or Expenses Operating Expenses Operating Income...
 Calculate the following financial ratios for fiscal year 2018
only using the "Consolidated Statements of Earn" and "Consolidated
Balance Sheets" worksheets in Starbucks 2017 and 2018 Annual
Financial Statements : Current Ratio, Cash Ratio, Inventory
Turnover, Days Sales in Inventory, Long Term Debt Ratio, Times
Interest Earned, Gross Profit Margin, Net Profit Margin, Return on
Equity, Return on Assets.
12 Months Ended Oct. 01, 2017 Sep. 30, 2018 Oct. 02, 2016 $ 22,386.8 9,034,3 6,493.3 500.3 1,011.4 1,450.7 153.5 18,643.5...
Calculate the following financial ratios for fiscal year 2018
only using the "Consolidated Statements of Earn" and "Consolidated
Balance Sheets" worksheets in Starbucks 2017 and 2018 Annual
Financial Statements : Current Ratio, Cash Ratio, Inventory
Turnover, Days Sales in Inventory, Long Term Debt Ratio, Times
Interest Earned, Gross Profit Margin, Net Profit Margin, Return on
Equity, Return on Assets.
12 Months Ended Oct. 01, 2017 Sep. 30, 2018 Oct. 02, 2016 $ 22,386.8 9,034,3 6,493.3 500.3 1,011.4 1,450.7 153.5 18,643.5...
 Calculate the following financial ratios for fiscal year 2018
only using the "Consolidated Statements of Earn" and "Consolidated
Balance Sheets" worksheets in Starbucks 2017 and 2018 Annual
Financial Statements: Current Ratio, Cash Ratio, Inventory
Turnover, Days Sales in Inventory, Long Term Debt Ratio, Times
Interest Earned, Gross Profit Margin, Net Profit Margin, Return on
Equity, Return on Assets.
12 Months Ended Oct. 01, 2017 Sep. 30, 2018 Oct. 02, 2016 $ 22,386.8 9,034,3 6,493.3 500.3 1,011.4 1,450.7 153.5 18,643.5 $...
Calculate the following financial ratios for fiscal year 2018
only using the "Consolidated Statements of Earn" and "Consolidated
Balance Sheets" worksheets in Starbucks 2017 and 2018 Annual
Financial Statements: Current Ratio, Cash Ratio, Inventory
Turnover, Days Sales in Inventory, Long Term Debt Ratio, Times
Interest Earned, Gross Profit Margin, Net Profit Margin, Return on
Equity, Return on Assets.
12 Months Ended Oct. 01, 2017 Sep. 30, 2018 Oct. 02, 2016 $ 22,386.8 9,034,3 6,493.3 500.3 1,011.4 1,450.7 153.5 18,643.5 $...
Most questions answered within 3 hours.
-
A college student is employed as a door-to-door newspaper
salesman. Historical data suggests that the student...
asked 38 minutes ago -
MATLAB HW 11 problem using Switch Case and Input commands
Write a script file that calculates...
asked 23 minutes ago -
Considering gravitational time dilation, calculate the time that
passes in Earth’s surface while 1 hour passes...
asked 1 hour ago -
Minitab Problem: Take the Lake Hume June rainfall data and find
use the processes outlined in...
asked 1 hour ago -
X Company is trying to decide whether to continue using old
equipment to make Product A...
asked 1 hour ago -
IN PYTHON ONLY !! Program 2: Re-work
program #5 (WeeklyHours) from the previous assignment such that...
asked 2 hours ago -
The average length of time between arrivals at a turnpike
toll-booth is 26 seconds. What is...
asked 4 hours ago -
(a) A piston at 6.1 atm contains a gas that occupies a volume of
3.5 L....
asked 5 hours ago -
Please answer true or false. Words
cannot be changed or added in to make it true...
asked 5 hours ago -
An empty test tube weighs 15.923 grams. Then,
MgCl2•6H2O is added into the test tube. After...
asked 5 hours ago -
Assume memory access is 10 units of time and disk access is
10000 units of time....
asked 5 hours ago -
1. Are all good samples random?
2. Magazines often report surveys giving statistics such as “63%...
asked 6 hours ago