

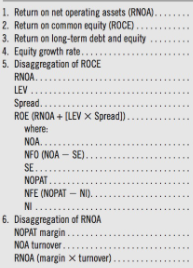
Use the information from the Income Statements and Balance Sheets to calculate the ratios in the image below for years provided (Numbers 1-6):

Please provide examples of each equation used so that I may create an excel file and replicate process.
Homework Answers
RNOA = Net Income After Tax / Net Operating Assets
Net Operating Assets = Current Assets - Current Liabilities
For Jan ,2019, NOA = 13292 - 3950 = 9342 RNOA = 4141 / 9342 = 44.32%
For Jan ,2018, NOA = 7471 RNOA = 3047 / 7471 = 40.78%
For Jan ,2018, NOA = 5793 RNOA = 1666 / 5793 = 28.75%
For Jan ,2018, NOA = 4556 RNOA = 614 / 4556 = 13.47%
ROCE = Net Income / Average Outstanding Shares
For Jan 2019, ROCE = 4141 / (7471+9342)/2 = 4141/8391.5 = 49.34%
For Jan 2018, ROCE = 3047 / (5762+7471)/2 = 3047/6616.5 = 46.05%
For Jan 2017, ROCE = 1666 / (4469+5762)/2 = 1666/5115.5 = 32.56%
Return on Long Term Debt and Equity = Net Income / Average Long Term Debt and Equity
For Jan 2019, ROLTDE = 4141 / (7471+9342+1988+1985)/2 = 4141/10393 = 39.84%
For Jan 2018, ROLTDE = 3047 / (5762+7471+1983+1985)/2 = 3047/8585.5 = 35.49%
For Jan 2017, ROLTDE = 1666 / (4469+5762+1983+0)/2 = 1666/6107 = 27.28%
Equity Growth Rate = (Net Income - Dividends) / Shareholders' Equity
For Jan 2019, Dividend = 9342*0.610 = 5699, EGR = (4141 - 5699) / 9342 = -16.67%
For Jan 2018, Dividend = 7471*0.570 = 4258, EGR = (3047 - 4258) / 7471 = -16.20%
For Jan 2017, Dividend = 5762*0.485 = 2795, EGR = ( 1666- 2795) / 5762 = -19.59%
ROCE is disaggregated into the Various components to help the analyst to gain more insight about the financial performance of the firm
ROCE = RNOA + Leverage x Spread.
Leverage = Debt-to-Equity Ratio = Total Liabilities / Total Shareholder's Equity
Add Answer to:
Use the information from the Income Statements and
Balance Sheets to calculate the ratios in the...
Balance sheets and income statements for Nordstrom, Inc., follow. Refer to these financial statements to answer the requ...
Balance sheets and income statements for Nordstrom, Inc., follow. Refer to these financial statements to answer the requirements. Nordstrom, Inc. Consolidated Statements of Earnings For Fiscal Years Ended ($ millions) 2016 2015 2014 Net Sales $14,095 $13,110 $12,166 Credit card revenues 342 396 374 Total revenues 14,437 13,506 12,540 Cost of sales and related buying and occupancy costs (9,168) (8,406) (7,737) Selling, general and administrative expenses (4,168) (3,777) (3,453) Earnings before interest and income taxes 1,101 1,323 1,350 Interest expense,...
Analysis and Interpretation of Profitability Balance sheets and income statements for Nordstrom, Inc., follow. Refer to...
 Analysis and Interpretation of Profitability Balance sheets and income statements for Nordstrom, Inc., follow. Refer to these financial statements to answer the requirements. Nordstrom, Inc. Consolidated Statements of Earnings For Fiscal Years Ended ($ millions) 2016 2015 2014 Net Sales $14,095 $13,110 $12,166 Credit card revenues 342 396 374 Total revenues 14,437 13,506 12,540 Cost of sales and related buying and occupancy costs (9,168) (8,406) (7,737) Selling, general and administrative expenses (4,168) (3,777) (3,453) Earnings before interest and income taxes...
Analysis and Interpretation of Profitability Balance sheets and income statements for Costco Wholesale Corporation follow. Costco...
 Analysis and Interpretation of Profitability Balance sheets and income statements for Costco Wholesale Corporation follow. Costco Wholesale Corporation Consolidated Statements of Earnings For Fiscal Years Ended ($ millions) September 2, 2018 Total revenue $141,576 Operating expenses Merchandise costs 123,152 Selling, general and administrative 13,876 Preopening expenses 68 Operating Income 4,480 Other income (expense) Interest expense 159 Interest income and other, ne (121) Income before income taxes 4,442 Provision for income taxes 1,263 Net income including noncontrolling interests 3,179 Net income...
this is a clearer picture .. thanks Direct Computation of Nonoperating Return Balance sheets and income...
 this is a clearer picture .. thanks
Direct Computation of Nonoperating Return Balance sheets and income statements for Costco Wholesale Corporation follow. Costco Wholesale Corporation Consolidated Statements of Earnings For Fiscal Years Ended ($ millions) August 28, 2016 August 30, 2015 August 31, 2014 Revenue Net Sales $116,073 $113,666 $110,212 Membership fees 2,646 2,533 2,428 Total revenue 118,719 116,199 112,640 Operating expenses Merchandise costs 102,901 101,065 98,458 Selling, general and administrative 12,068 11,445 10,899 Preopening expenses 65 63 Operating Income...
this is a clearer picture .. thanks
Direct Computation of Nonoperating Return Balance sheets and income statements for Costco Wholesale Corporation follow. Costco Wholesale Corporation Consolidated Statements of Earnings For Fiscal Years Ended ($ millions) August 28, 2016 August 30, 2015 August 31, 2014 Revenue Net Sales $116,073 $113,666 $110,212 Membership fees 2,646 2,533 2,428 Total revenue 118,719 116,199 112,640 Operating expenses Merchandise costs 102,901 101,065 98,458 Selling, general and administrative 12,068 11,445 10,899 Preopening expenses 65 63 Operating Income...
Analysis and Interpretation of Profitability Balance sheets and income statements for Costco Wholesale Corporation follow. Costco...
 Analysis and Interpretation of Profitability Balance sheets and income statements for Costco Wholesale Corporation follow. Costco Wholesale Corporation Consolidated Statements of Earnings For Fiscal Years Ended (5 millions) September 2, 2018 Total revenue $141,576 Operating expenses Merchandise costs 123,152 Selling general and administrative 13,876 Preopening expenses 68 Operating Income 4,480 Other Income (expense) Interest expense 159 Interest income and other, net (121) Income before income taxes Provision for income taxes 1,263 Net income including noncontrolling interests 3,179 Net income attributable...
Analysis and Interpretation of Profitability Balance sheets and income statements for Costco Wholesale Corporation follow. Costco...
 Analysis and Interpretation of Profitability Balance sheets and income statements for Costco Wholesale Corporation follow. Costco Wholesale Corporation Consolidated Statements of Earnings For Fiscal Years Ended ($ millions) August 28, 2016 August 30, 2015 August 31, 2014 Revenue Net Sales $116,073 $113,666 $110,212 Membership fees 2,646 2,533 2,428 Total revenue 118,719 116,199 112,640 Operating expenses Merchandise costs 102,901 101,065 98,458 Selling, general and administrative 12,068 11,445 10,899 Preopening expenses 63 Operating Income 3,672 3,624 3,220 Other income (expense) Interest expense...
Analysis and Interpretation of Profitability Balance sheets and income statements for 3M Company follow. 3M COMPANY...
 Analysis and Interpretation of Profitability Balance sheets and income statements for 3M Company follow. 3M COMPANY Consolidated Statements of Income For Years ended December 31 (5 millions) 2018 2017 Net sales $32,765 $31,657 Operating expenses Cost of sales 16,682 16,055 Selling, general and administrative expenses 7,602 6,626 Research, development and related expenses 1,821 1,870 Gain on sale of businesses (547) Total operating expenses 25,558 23,965 Operating income 7,207 7,692 Other expense, net* 207 144 Income before income taxes 7,000 7,548...
Analysis and Interpretation of Profitability Balance sheets and income statements for 3M Company follow. Consolidated Statements...
Analysis and Interpretation of Profitability Balance sheets and income statements for 3M Company follow. Consolidated Statements of Income Years ended December 31 ($ millions) 2010 2009 2008 Net sales $26,662 $23,123 $25,269 Operating expenses Cost of sales 13,831 12,109 13,379 Selling, general and administrative expenses 5,479 4,907 5,245 Research, development and related expenses 1,434 1,293 1,404 Loss/(gain) from sale of business -- -- 23 Total operating expenses 20,744 18,309 20,051 Operating income 5,918 4,814 5,218 Interest expenses and income Interest...
Balance sheets and income statements for 3M Company follow. Consolidated Statements of Income Years ended December...
 Balance sheets and income statements for 3M Company follow. Consolidated Statements of Income Years ended December 31 ($ millions) 2009 2008 2007 Net sales $23,123 $25,269 $24.462 Operating expenses Cost of sales 12.109 13.379 12,735 Selling. general and administrative expenses 4,907 5,245 5.015 Research, development and related expenses 1,293 1,404 1,368 Loss/(gain) from sale of business 23 (849) Total operating expenses 18.309 20,051 18.269 Operating income 4.814 5.218 6.193 Interest expenses and income Interest expense 219 215 210 Interest income...
Analysis and Interpretation of Profitability Balance sheets and income statements for Costco Wholesale Corporation follow. Costco...
 Analysis and Interpretation of Profitability Balance sheets and income statements for Costco Wholesale Corporation follow. Costco Wholesale Corporation Consolidated Statements of Earnings For Fiscal Years Ended ($ millions) August 28, 2016 August 30, 2015 August 31, 2014 Revenue Net Sales $116,073 $113,666 $110,212 Membership fees 2,646 2,533 2,428 Total revenue 118,719 116,199 112,640 Operating expenses Merchandise costs 102,901 101,065 98,458 Selling, general and administrative 12,068 11,445 10,899 Preopening expenses 63 Operating Income 3,672 3,624 3,220 Other income (expense) Interest expense...
 Analysis and Interpretation of Profitability Balance sheets and income statements for Nordstrom, Inc., follow. Refer to these financial statements to answer the requirements. Nordstrom, Inc. Consolidated Statements of Earnings For Fiscal Years Ended ($ millions) 2016 2015 2014 Net Sales $14,095 $13,110 $12,166 Credit card revenues 342 396 374 Total revenues 14,437 13,506 12,540 Cost of sales and related buying and occupancy costs (9,168) (8,406) (7,737) Selling, general and administrative expenses (4,168) (3,777) (3,453) Earnings before interest and income taxes...
 Analysis and Interpretation of Profitability Balance sheets and income statements for Costco Wholesale Corporation follow. Costco Wholesale Corporation Consolidated Statements of Earnings For Fiscal Years Ended ($ millions) September 2, 2018 Total revenue $141,576 Operating expenses Merchandise costs 123,152 Selling, general and administrative 13,876 Preopening expenses 68 Operating Income 4,480 Other income (expense) Interest expense 159 Interest income and other, ne (121) Income before income taxes 4,442 Provision for income taxes 1,263 Net income including noncontrolling interests 3,179 Net income...
 this is a clearer picture .. thanks
Direct Computation of Nonoperating Return Balance sheets and income statements for Costco Wholesale Corporation follow. Costco Wholesale Corporation Consolidated Statements of Earnings For Fiscal Years Ended ($ millions) August 28, 2016 August 30, 2015 August 31, 2014 Revenue Net Sales $116,073 $113,666 $110,212 Membership fees 2,646 2,533 2,428 Total revenue 118,719 116,199 112,640 Operating expenses Merchandise costs 102,901 101,065 98,458 Selling, general and administrative 12,068 11,445 10,899 Preopening expenses 65 63 Operating Income...
this is a clearer picture .. thanks
Direct Computation of Nonoperating Return Balance sheets and income statements for Costco Wholesale Corporation follow. Costco Wholesale Corporation Consolidated Statements of Earnings For Fiscal Years Ended ($ millions) August 28, 2016 August 30, 2015 August 31, 2014 Revenue Net Sales $116,073 $113,666 $110,212 Membership fees 2,646 2,533 2,428 Total revenue 118,719 116,199 112,640 Operating expenses Merchandise costs 102,901 101,065 98,458 Selling, general and administrative 12,068 11,445 10,899 Preopening expenses 65 63 Operating Income...
 Analysis and Interpretation of Profitability Balance sheets and income statements for Costco Wholesale Corporation follow. Costco Wholesale Corporation Consolidated Statements of Earnings For Fiscal Years Ended (5 millions) September 2, 2018 Total revenue $141,576 Operating expenses Merchandise costs 123,152 Selling general and administrative 13,876 Preopening expenses 68 Operating Income 4,480 Other Income (expense) Interest expense 159 Interest income and other, net (121) Income before income taxes Provision for income taxes 1,263 Net income including noncontrolling interests 3,179 Net income attributable...
 Analysis and Interpretation of Profitability Balance sheets and income statements for Costco Wholesale Corporation follow. Costco Wholesale Corporation Consolidated Statements of Earnings For Fiscal Years Ended ($ millions) August 28, 2016 August 30, 2015 August 31, 2014 Revenue Net Sales $116,073 $113,666 $110,212 Membership fees 2,646 2,533 2,428 Total revenue 118,719 116,199 112,640 Operating expenses Merchandise costs 102,901 101,065 98,458 Selling, general and administrative 12,068 11,445 10,899 Preopening expenses 63 Operating Income 3,672 3,624 3,220 Other income (expense) Interest expense...
 Analysis and Interpretation of Profitability Balance sheets and income statements for 3M Company follow. 3M COMPANY Consolidated Statements of Income For Years ended December 31 (5 millions) 2018 2017 Net sales $32,765 $31,657 Operating expenses Cost of sales 16,682 16,055 Selling, general and administrative expenses 7,602 6,626 Research, development and related expenses 1,821 1,870 Gain on sale of businesses (547) Total operating expenses 25,558 23,965 Operating income 7,207 7,692 Other expense, net* 207 144 Income before income taxes 7,000 7,548...
 Balance sheets and income statements for 3M Company follow. Consolidated Statements of Income Years ended December 31 ($ millions) 2009 2008 2007 Net sales $23,123 $25,269 $24.462 Operating expenses Cost of sales 12.109 13.379 12,735 Selling. general and administrative expenses 4,907 5,245 5.015 Research, development and related expenses 1,293 1,404 1,368 Loss/(gain) from sale of business 23 (849) Total operating expenses 18.309 20,051 18.269 Operating income 4.814 5.218 6.193 Interest expenses and income Interest expense 219 215 210 Interest income...
 Analysis and Interpretation of Profitability Balance sheets and income statements for Costco Wholesale Corporation follow. Costco Wholesale Corporation Consolidated Statements of Earnings For Fiscal Years Ended ($ millions) August 28, 2016 August 30, 2015 August 31, 2014 Revenue Net Sales $116,073 $113,666 $110,212 Membership fees 2,646 2,533 2,428 Total revenue 118,719 116,199 112,640 Operating expenses Merchandise costs 102,901 101,065 98,458 Selling, general and administrative 12,068 11,445 10,899 Preopening expenses 63 Operating Income 3,672 3,624 3,220 Other income (expense) Interest expense...
Most questions answered within 3 hours.
-
A turtle ambles leisurely, as turtles tend to do, when it moves
from a location with...
asked 1 second ago -
Do you think that the current economic system of the US is a
true capitalist system...
asked 1 minute ago -
QUESTION 7 Depreciation expense is a use of funds True False
QUESTION 8 A firm's operating...
asked 3 minutes ago -
Calculate the percent ionization of formic acid solutions having
the following concentrations? (This is all that...
asked 8 minutes ago -
Aluminum, silicon, and oxygen form minerals known as
aluminosilicates. How many moles of aluminum are in:...
asked 10 minutes ago -
When Sr(CH3COO)2 (aq) + NiSO4
(aq) are mixed is there a reaction and if so what...
asked 20 minutes ago -
How many grams of solid ammonium chloride should be added to
1.50 L of a 0.279...
asked 22 minutes ago -
Problem 1: Portfolio of Options Draw the resulting payoff from
the following combination of options. Make...
asked 26 minutes ago -
The Long Haul Trucking Company is developing metrics for its
drivers. The company computes
variable costs...
asked 35 minutes ago -
Dada la gramática siguiente en EBNF:
< oración > ::= < A > < B >...
asked 44 minutes ago -
This is also for the Unknown 3 I am doing for microbiology. If
you could please...
asked 46 minutes ago -
1) Optimization problem
1 Max U(x, y) = x1^0.5 + x2^0.5
s.t. x1 + x2...
asked 52 minutes ago